CHAPTER 1: INTRODUCTION
Today, customer responsiveness is a main focus of many companies in global market. It becomes more competitive for those who can satisfy customers best. On- time delivery is one of the most important factors in deciding customer satisfaction after product attributes. In fact, company may lose sale opportunity or suffer the impact of cancelled orders because of late delivery. In a make to order production, raw material availability is a necessary element to ensure on time delivery since company cannot deliver products when inventory is out. Therefore, in today’s highly competitive global economy, inventory has become the focus of improvement for many companies. The most common inventory management strategy is used to prevent such stock outs is safety stock. Safety stock act as insurance by improving material availability and buffering against the uncertainties face by the company
Therefore, in today dynamic global economy, with fluctuation in demand, uncertainty in supply and global procurement, determining an optimal level of safety stock has become a challenge task which gain attention from inventory managers.
Problem Statement
ABC (Pvt) Ltd is a modern and an international electronic manufacturing company. Its Sri Lankan facility produces two main products namely, printed Circuit Board Assemblies and Cable harnesses. Cable harnessing operates as a separate business section within the company and its employees nearly 120+ productive employees. Very recently planned vs. actual performances of the company has declined to 85 percent. Unavailability of raw material on time which accounts for the 38 percent of this problem has been identified as the major cause of the poor performances of the section.
Improvement objective
Main objective of this study is to propose a mathematical approach to define an optimal level of safety stock for the cable inventory at ABC Sri Lanka. Thereby, to improve the delivery performances of the cable harness section to 90 percent.
Scope of the study
This study mainly focus on the wire inventory of cable harness section, and due to the time limitation two wire materials were randomly selected for further analysis.
Structure of the report
The report was divided into five main parts. Chapter one provides an overall structure of the study and it will provide a brief description about the background of the study the problem statement, improvement objectives and limitations of the study. Chapter two will review the key concepts, findings of similar studies done previously and will provide the theoretical basis of the study. Chapter three provides a brief introduction about the company and the cable harness section. Chapter five explain how the data was analyzed and findings of the analysis. Finally chapter six provides the recommendation to mitigate the problems identified in the chapter five.
CHAPTER 2: LITERATURE REVIEW
In many industries, inventory is one of the dominant costs. For many managers, effective supply chain management is synonymous with reducing inventory levels in the supply chain. The goal of effective inventory management in the supply chain is to have the correct inventory at the right place at the right time to minimize system cost while satisfying customer service requirements. Unfortunately, managing inventory in complex supply chain is extremely difficult, and it has a greater impact on the customer service level and on overall cost.
According to Waters (2003), inventory is a list of things held in stock. He also defined stocks as supplies of goods and materials that are held by an organization. According to Hopp & Spearman (2011), inventories in supply chain can be dividing into four categories
- Raw material are components, subassemblies, or materials that are purchased from outside the plant and used in the fabrication/ assembly processes inside the plant
- Work in process includes all unfinished parts or products that have been released to a production line
- Finished goods inventory is finished product that has not been sold
- Spare Parts are components that are used to maintain or repair production equipment
This essay will discuss only about the wire inventory (Raw material) in relation to cable harness section of ABC (Pvt) Ltd
Mainly there are three cost are that are relevant in inventory management. They are
- Ordering Cost which includes cost of paper work, expediting cost, labour cost of purchasing department
- Holding Cost which includes interest on capital, insurance and tax charges, storage cost, obsolescence cost
- Stock out Cost which includes cost of lost production or sales and it occurs when an item is needed but it cannot be supplied from stock
Inventory is costly and difficult to manage. But organizations tend to hold inventory for variety of reasons. According to Simchi Levi, Kaminsky, Simchi Levi & Shankar (2010) Inventory is held due to
- Unexpected changes in customer demand. Customer demand has always been hard to predict, and uncertainty in customer demand has increased due to short life cycle of an increased number of products and the presence of many competing products in the marketplace
- Lead times. Even if there is no uncertainty in demand or supply, there is a need to hold inventory due to delivery lead times
- The presence in many situations of a significant uncertainty in the quantity and quality of the supply, supplier cost, and delivery time
- Economies of scale offered by transportation companies that encourages firms to transport large quantities of items, and therefore hold large inventories
The role of inventory is very important in enhancing the flexibility of the organization. Having an efficient level of inventory is a step towards increasing the inventory turnover in a company. According to the definition of turnover, decreasing the level of inventory helps to increase the turns. On the other hand, reducing inventory will lead to uncertainties and consequently stock outs. (Natarjan & Goyal, 1994, as cited in Amirjabbari & Bhuiyan, 2013) Therefore a safety stock is needed to protect against these uncertainties.
According to King (2011) safety stock simply is inventory that is carries to prevent stock outs. Stock outs stem from factors such as fluctuating customer demand, forecast inaccuracy, and variability in lead times for raw material or manufacturing. Safety stock is a function of the cycle service level, the demand uncertainty, the lead time and the lead time uncertainty (Chopra, Reinhardt & Dada, 2004). Lead time can be either procurement lead time, manufacturing lead time or delivery lead time. And this essay will only focus on procurement lead time, which is the time between the purchase order and the material availability at the plant. Safety stock determination is not intended to eliminate all the stock outs, but the majority of them.
Many managers use gut feelings to set safety stocks, while others base them on a portion of cycle stock level. While easy to execute, such techniques generally result in poor performances (King, 2011). The consequences of poor performance can be accounted for as an opportunity cost, i.e., the cost incurred for having used limited resources to avoid delayed deliveries of customer orders (Maia & Qassim,1998).There are many different methods and approaches in determining safety stock under different situations according to the literature.
Aleotti Maia & Qassim (1998) have proposed an optimization safety stock model with the objective of total inventory cost minimization. They also provided an analytical solution for an optimization model that determines whenever it is preferable to incur inventory or opportunity cost. Becker, Hartmann, Bertsch, Nywlt & Schmidt (2013) has proposed a dynamic method to calculate safety stock based on the statistical analysis of due date deviations.
Jung, Blau, Pekny, Rektlatis & Eversdyk (2008) have suggested a linear programming formulation with the control variables of safety stock. This model aims to minimize the total supply chain’s inventory and also meet the target of the service level. The interdependence between the service level at upstream and downstream stages of the supply chain, the nonlinear performance functions, and also the safety capacity constraint have been incorporated into this model.
A mathematical model that takes into account both lead time variability and demand variability as well as customer service level has suggested by King (2011). This model tries to balance between inventory cost and customer service level. He suggest three ways of calculating safety stocks when Demand is variable and lead time is constant, and when lead time variable, and demand is constant. According to King (2011) when both demand variability and lead time variability are present, statistical calculation can combine to give a lower total safety stock than the sum of the two individual calculation.
Simchi Levi, Kaminsky, Simchi Levi & Shankar (2010) present a similar model to calculate the safety stock, based on demand variability, lead time variability and service level. Safety stock is calculated base on the standard deviation of the replenishment time demand and the z score of the desired service level. Since this method is simple and easy to both calculate and understand this model was selected to calculate the safety stock of wire inventory of the cable harness section.
The amount of safety stock maintained helps the organization to achieve a desired service level. Service level is the probability that a demand is met directly from stock (Waters, 2003). As figure 1 show, when designing for a 95 percent service level, expect that 50 percent of the time, not all cycle stock will depleted and safety stock will not be needed. For another 445 percent of cycle, the safety stock will be sufficed. But in approximately 5 percent of replenishment cycles, expect a stock out (King, 2011).
Bhonsle, Rossitti & Robinson (2005) suggested that an organization can reduce inventory investment by calculating safety stock based on differentiated service level developed through risk level. They have developed a model for determining appropriate service level for different product based on demand fluctuation, lead time and internal criticality. For each variable they have compute a Risk Priority Number by multiplying the three scores of each item and get an appropriate service level.
Figure 1: Inventory designed for a 95% service level
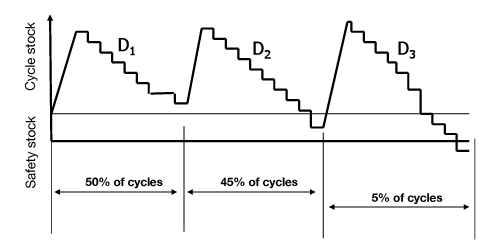
Source: king, P. L. (2011). Crack the code, understanding safety stock and mastering its equation.
A Formal method for choosing service level to meet an overall service level with minimum average investment in inventory is described in Hopp and Spearman (1993) as cited in in Hopp & Spearman (2011).
Designing for a higher service level, would result in fewer stock outs, this requires significantly more safety stock (King, 2011). Therefore there must be a balance between inventory cost and customer service. Once safety stock levels have been established, inventory levels should be monitored on an ongoing basis to determine if the inventory profile is as expected. Is the safety stock being consumed in about half of the cycles? Are service level targets being realized? If not, before any adjustments are made, perform a root cause analysis to see if any special causes are responsible for the deviations from expected results (King, 2011).
CHAPTER 3: INTRODUCTION TO THE COMPANY
Company Overview
ABC is a modern and an international electronic manufacturing service company. It started as a small regional contract electronic manufacturer in Switzerland by three people, in 1993. Later the company expanded rapidly in Europe, Asia and United States as well. Currently, ABC is the largest privately owned electronic contract manufacturer in the European Union.
Company operates four production facilities in Switzerland, Sri Lanka, USA and China. All four facilities are networked through common software tools, matched process capabilities and globally organized purchasing. Vario group manages high tech products from specification, and it covers the entire cycle from product development through to tested equipment or systems.
In 1998 ABC started operations in Sri Lanka as a joint venture with XYZ Electronics Ltd. Later, in the year 2003 ABC fully acquired XYZ Electronics. And today ABC Sri Lanka is a competitive contract manufacturer especially in
- Printed Circuit Board Assembly
- Cable Harness
Cable Harness Section
ABC Sri Lanka started cable harness operations in 2012 and it produces engine harnesses for motorized recreational vehicles and also for light aircraft industries. Currently this section has provided employment for 120+ productive employees.
According to IPC (Association Connecting Electronic Industries) a cable harness is an assembly of wires and cables, usually made with breakouts, which are tied together or pulled into a rubber or plastic sheath, which transmit signals or electrical power.
Cable Harness section has only few customers in number. The main customer of the cable harness section accounts for nearly 75 percent of the sales of the cable harness section and nearly 40 percent of the total sales of the ABC Sri Lanka in 2015. And this number would greatly increase in coming years since the customer has selected ABC Sri Lanka as their main supplier. Therefore meeting customer demand in terms of quality, cost and on time delivery is very much important for the long term survival of this section. (Please see appendix A for a brief description of the supply chain of cable harness section.)
CHAPTER 4: PROBLEM ANALYSIS
Problem Overview
For any business, an important aspect of customer service is the ability to responsively deliver products to its customers. But very recently a planned vs. actual performance of the cable harness section has been declined to 85% on average while the target was 90%. See figure 2.
Figure 2: Planned vs. actual performance of cable harness section 2016
Source: Department_Cockpit_2016, Planning Department of ABC Sri Lanka
Then to identify the possible causes of the problem, data were further analyzed, and identified the following major causes that hinder the planned vs. actual performances as shown in figure 3.
Figure 3: Reasons for planned vs. actual failures
Source: Improving Delivery Performances_A3, submitted by KPI Delivery team of ABC Sri Lanka
Material delay which accounts for 38 percent was identified as the major cause for the above problem. This cause was also confirmed by the clear to build (CTB) statistics of the wire harness section (See figure 4).
Clear to Build is a method of checking availability of all components across multiple levels, ensuring orders are released into production only when all required materials are covered by the qualified suppliers. Clear to build takes into consideration many factors such as material availability, capacity availability, availability of required tools and equipments etc. But ABC take only material availability into account when calculating clear to build percentage, based on the assumption that other resources are readily available. Therefore ABC calculate clear to build percentage as a ratio between number of orders ready to build in CTB period and number of orders planned in CTB period
Figure 4: Clear to build % for cable harness Section-2016
Source: Clear to Build_Wire Harness Section_2016, Planning Department of ABC Sri Lanka
Clear to build percentage for wire harness section started to calculate from the calendar week 13 of 2016. Average clear to build target is 85 percent, and this directly affects to planned vs. actual performances and thereby delivery performances. In calendar week 19, clear to build percentage has been declined to 5 percent, as a result of a stock out situation of one material. Because of the unavailability of one material, production did not operate as planned. This resulted in a loss of capacity and failure to meet the delivery schedule.
Since clear to build percentage is less than the target, reasons for material delay and clear to build failure was then analyzed for the period of calendar week 13 to 19. Shipment delays and demand changes, which accounts for 84 percent, were identified as major causes of the material delay as shown in figure 5.
Figure 5: Reasons clear to build failures of wire harness section
Source: Improving Delivery Performances_A3, submitted by KPI Delivery team of ABC Sri Lanka
The scope of this essay will be limited to shipment delays which can be considered as lead time variability and the demand changes which can be considered as demand variability. Therefore now it is clear that both demand variability and lead time variability affects our planned vs. actual performances and thereby on time delivery performances of the wire harness section as well. But the company cannot compromise, on time delivery performances, because of demand and lead time variability, since it is critical to customer satisfaction and retention. Both these variability arises from external sources, therefore ABC need a method to absorb both supply lead time uncertainty and demand uncertainty.
Raw Material inventory of ABC
ABC Sri Lanka is currently having a raw material inventory of nearly LKR 200,000,000 and it accounts for nearly 10,000 stock keeping units (SKUs). This inventory includes raw materials for both PCB and Cable Harness sections.
Main raw materials of cable harness section includes 75 different types of wires, 55 different types of connectors, 48 types of tubes, 17 types of crimps, 11 types of clips, 8 different types of tape,6 types of dummies, 2 types of sleeving. Among the mentioned raw materials, wires are the most important and widely consumed raw material. Wire stock of ABC Sri Lanka value nearly LKR 50,000,000 or 2500 km of wires. And it represents 25 percent of the total raw material inventory of ABC Sri Lanka. Even though the Company holds a wire inventory of 2500 km, it faced several stock out situations recently. The result was cable harness section could not operate as they had planned, and ultimately it affected clear to build performance as well as planned vs actual performances. Also the dead stock inventory of wires amounted to 125 km.
These figures highlight that ABC currently carry too much of slow moving inventory, and thereby they have tied up their money in working capital and on The figure 5 shown above clearly emphasizes the stock outs stem from shipment delays and changes in demand. Therefore it is clear that ABC Sri Lanka need to change their inventory management strategies, in order to remain competitive in the market place. There are many strategies that ABC can adopt to cope up with these uncertainties and this essay will only focus on the impact of safety stock on demand and lead time uncertainty or in other words, to show that the safety stocks can be used to mitigate the uncertainties and thereby improve the delivery performances of the company.
Since wire stock represents a considerable portion of the company’s raw material inventory this essay will focus only on wire stock of ABC Sri Lanka. To analyze the demand and lead time uncertainty two wire materials were randomly selected. (Material no 2021436 &2021620)
Analysis of safety stock requirement
The level of safety stock is influenced by three factors. They are,
- Lead time uncertainty
- Demand uncertainty and
- Service level.
Each of these factors will be analyzed in detail before determining safety stock levels for wire inventory
Lead time uncertainty
There are three pre qualified suppliers for wires. One supplier is from Germany, while other two are from Asia. Company can procure raw materials only from pre qualified suppliers by the customer, because all cable harness products are used in automobile and aircraft industry, in which quality of raw materials are considered as a prime importance. Since the company is purchasing customized wires according to customer specification, lead times of wires are long. Lead time varies from 42 days 90 days. Lead time may vary from one material to another.
Following table shows the standard lead time and actual lead time for two wire articles.
Table 1: Planned vs. actual material lead time for article no 2021436
| Material | Purchasing Document | Purchase Order Date | Delivery Date | Planned delivery time | Calc. RLT | Mean planned del. time | Delta RLT | Tot. repl. lead time |
| 2021436 | 4500203276 | 5/28/2015 | 9/26/2015 | 84 | 119 | 139 | 35 | 87 |
| 2021436 | 4500203562 | 6/20/2015 | 10/28/2015 | 84 | 125 | 139 | 41 | 87 |
| 2021436 | 4500204015 | 8/28/2015 | 2/21/2016 | 84 | 175 | 139 | 91 | 87 |
| 2021436 | 4500204540 | 10/10/2015 | 3/7/2016 | 84 | 147 | 139 | 63 | 87 |
| 2021436 | 4500206683 | 11/26/2015 | 4/10/2016 | 84 | 131 | 139 | 47 | 87 |
Source: Controlling Cockpit, SAP ERP System of ABC Sri Lanka
Table 2: Planned vs. actual material lead time for article no 2021620
| Material | Purchasing Document | Purchase Order Date | Delivery Date | Planned delivery time | Calc. RLT | Mean planned del. time | Delta RLT | Tot. repl. lead time |
| 2021620 | 4500204406 | 6/9/2015 | 8/6/2015 | 56 | 44 | 68 | 12 | 59 |
| 2021620 | 4500205448 | 6/17/2015 | 8/18/2015 | 56 | 50 | 68 | 6 | 59 |
| 2021620 | 4500206301 | 6/24/2015 | 9/16/2015 | 56 | 85 | 68 | 29 | 59 |
| 2021620 | 4500208040 | 7/9/2015 | 10/6/2015 | 56 | 77 | 68 | 21 | 59 |
| 2021620 | 4500209649 | 7/22/2015 | 10/15/2015 | 56 | 85 | 68 | 29 | 59 |
Source: Controlling Cockpit, SAP ERP System of ABC Sri Lanka
According to table 1, planned lead time of material no 2021436 is 84 days. But the actual lead time varies from 119 days to 175 days. Mean RLT demand is 139 days while the standard deviation is 20 days. For the material no 2021620, as shown in table 2, planned delivery time is 56 days, while actual lead times varies from 44 days to 85 days. Average RLT demand is 68 days and the standard deviation is 17 days. For the material no 2021436 coefficient of variation (CV) of the lead time is 0.14 while for the material no 202162 coefficient of variation is 0.25.
Demand uncertainty
Purchasing department procure wire materials based on the realized demand (production orders) and the forecasted demand (Planned orders) depending on the lead time of each material. Table 3 shows the actual demand and the forecasted demand for the material no 2021436 and 202162 for the months of March and April of 2016.
Table 3: Actual vs. forecasted demand for material no 2021436 & 2021620
| Description | 2021436 | 2021620 | ||
| March | April | March | April | |
| Forecasted Demand in meters | 767.58 | 3341.8 | 2859.32 | 10749.78 |
| Actual Demand in meters | 527.59 | 2153.4 | 2671.13 | 6534.22 |
Source: Controlling Cockpit, SAP ERP System of ABC Sri Lanka
The total forecasted demand for material no 2021436 in April 2016 is 3,341 meters while the actual demand is 2153 meters. And for the material no 2021620 forecasted demand is 10,749 meters while actual demand was 6534 meters. During these two periods demand for these two materials has fluctuated and table 4 shows you the mean and standard deviation of demand for these two materials. For the material no 2021436 coefficient of variation is 0.5 while the coefficient of variation for material no 2021620 is 0.38
Table 4: Mean & Standard deviation of demand for article no 2021436 & 2021620
| Material no | Average Demand in meters | Standard Deviation | Coefficient of Variation |
| 2021436 | 2139.17 | 1177.9 | 0.550634 |
| 2021620 | 6790.59 | 2628.49 | 0.387078 |
Service level
The target on time delivery performance for the cable harness section is 95 percent. But when setting safety stock the same level of service level may not be appropriate for all the materials. Service level must be independent for group of products based on criterias such as strategic importance, profit margin, or rupee value. Then the SKUs with greater value to the business will have more safety stock, and vice versa.
According to Bhonsle, Rossitti & Robinson (2005), an organization can reduce inventory investment by calculating safety stock based on differentiated service level developed through risk level. They have developed a model for determining appropriate service level for different products based on demand fluctuation, lead time and internal criticality. For each variable they have compute a Risk Priority Number (RPN) by multiplying the three scores of each item and getting an appropriate service level. Since this method is simple and all the required data are available it is easy to calculate RPN number for the selected two materials.
Table 5: RPN Number calculation for material no 2021436 & 2021620
| Material | CV of demand | DFS | Lead time | SRS | Criticality | ICS | RPN | Service level |
| 2021436 | 0.55 | 4 | 139 | 9 | High | 7 | 252 | 90% |
| 2021620 | 0.38 | 3 | 68 | 9 | High | 7 | 189 | 80% |
Please see appendix B for RPN Scores and method of calculation. Calculated service level for material number 2021436 is same as the company’s target service level and calculated service level is less than the material number 2021620.
Determination of safety stock
Since both demand variability and lead time variability is present, we can use the following equation to calculate safety stock for the selected two materials
Safety Stock= Z √Average LT X STD of Demand2 + Average Demand2 X STD of LT2
In other words it is simply the Z score into standard deviation of replenishment time demands. This equation was adopted from Simchi Levi, D & Simchi Levi, E. (2007) Designing and managing the supply chain (Second Edition)
Table 6: Safety Stock calculation for Material no 2021436 & 2021620
| Material | Average Monthly Demand | STD of Demand | Average RLT in months | STD of RLT | Service level | Z Score | Safety Stock | Price per meter in LKR | Investment in Safety Stock in LKR |
| 2021436 | 2139.174 | 1177.9 | 4.63 | 0.67 | 90% | 1.281552 | 3728.04 | 18.61 | 69,378.85 |
| 2021620 | 6790.599 | 2628.49 | 2.27 | 0.57 | 80% | 0.841621 | 4648.50 | 18.45 | 85,764.86 |
For the material no 2021436 safety stock requirement is 3728.04 meters and for material no 2021620 safety stock requirement is 4648.50 meters. Rounding value of these two materials are 100, therefore if we rounded off these two materials to the nearest hundred, safety stock requirement will be 3800 and 4700 meters for material no 2021436 and 2021620 respectively. Z score is also known as standard score and it can be obtain using Norm. S.INV equation in excel. (See table 7 to understand how the safety stock varies with the service level or Z score )
As illustrated in figure 6 the relationship is non linear. Therefore a higher service level requires a higher safety stock. Normally organizations set their service level between 80 to 95 percent, and statistically speaking a service level of 100 percent is unattainable.
Table 7: Relationship between service level and safety stock investment for material no 2021620
| STD of RLT demand | Service level | Z Score | Safety Stock in meters | Inventory investment in LKR |
| 5523.27 | 0.6 | 0.253347103 | 1,400.00 | 25,830.00 |
| 5523.27 | 0.7 | 0.524400513 | 2,900.00 | 53,505.00 |
| 5523.27 | 0.8 | 0.841621234 | 4,700.00 | 86,715.00 |
| 5523.27 | 0.85 | 1.036433389 | 5,800.00 | 107,010.00 |
| 5523.27 | 0.9 | 1.281551566 | 7,100.00 | 130,995.00 |
| 5523.27 | 0.95 | 1.644853627 | 9,100.00 | 167,895.00 |
| 5523.27 | 0.97 | 1.880793608 | 10,400.00 | 191,880.00 |
| 5523.27 | 0.98 | 2.053748911 | 11,400.00 | 210,330.00 |
| 5523.27 | 0.99 | 2.326347874 | 12,900.00 | 238,005.00 |
| 5523.27 | 0.999 | 3.090232306 | 17,100.00 | 315,495.00 |
Figure 6: Service level Vs inventory investment
CHAPTER 5: RECOMMENDATIONS & CONCLUSION
Recommendations
Safety stock provides a protection against demand and lead time variability, but it also increases the inventory cost of the company. Therefore company must invest to reduce these stocks for their raw materials. It can be done in two ways
Reduce variability in demand
The results of the above variability analysis demonstrate that demand variability is the dominant influence on safety stock requirement (Based on the calculated CV). With the recognition of what factors dominate, it is easier for ABC to focus on improvement efforts. Therefore if the company needs to reduce its safety stock requirement, it must focus on reducing demand variability than the lead time variability. Following strategies can be used to reduce the demand variability for raw material
- Improve production levelling
Ideally, production can be easily levelled where demand is constant, but in the real world it is the actual customer demand that fluctuates. (See figure 7 to see how the demand of the main customer of the cable harness section varies.)
Figure 7: Forecasted demand of the main customer of cable harness section from calendar week 19 to 39
Source: Controlling cockpit, SAP ERP system of ABC Sri Lanka
To deal with these customer fluctuations two approaches can be adopted, which are demand levelling and production levelling. These approaches have been adopted to help prevent the fluctuations in production, which is done by trying to keep fluctuations in the final assembly line to zero. For example, Toyota never assembles the same model of car in a batch. How Toyota works is, production is levelled by making first one model, then another, etc until the batch is completed. With production levelling, it can refer to levelling by volume or levelling by product mix or type.
In order to level the production first the product must be categorized based on their volumes or sales value. The product category that accounts for more than 90 percent of the sales of the company can be categorized as Green stream. For the green stream products the company can apply ‘‘every product every cycle concept’’ or fixed repeating schedule since the demand is high for this category than those of others. By using a fixed cycle the company will be able to level the production as follows
Figure 8: Production leveling for Green stream products of the main customer of the cable harness section
Please see Appendix C for more details on production leveling. Then the Company can apply the same concept for remaining products as well. As a result of this method, production will be driven by planned schedule than by the customer delivery dates. As a result the company will be able to manage their capacities in a better manner as well. If the company choose to produce according to customer demand, in some weeks there will be a huge loss in capacity while in other weeks may seek permission for extra working hours. As a result the demand for raw materials will also be more stable since the demand for raw materials stem from the demand for end product. Reduction in variability can be shown as follows
Table 8: Average monthly demand and standard deviation of green category products
| Average weekly Demand | Standard Deviation of Demand | Coefficient of variation | |
| Before production levelling | 1,228 | 1354.42582 | 1.10278157 |
| After production levelling | 1,363 | 130.915049 | 0.09608444 |
Reduce Variability in lead time
Two main recommendations can be given to mitigate the effect of lead time variability
- Move the supply location closer as much as possible. Currently ABC procure wire materials from suppliers located in Germany and Asia. For an example by moving the supplier location from Europe to Asian region more particularly south Asian region or Sri Lanka, company can reduce the lead time significantly by eliminating shipping or voyage time. For that the company must find new suppliers who can provide quality raw materials and must get qualified them from the customers.
- Vendor managed inventories (VMI) is also another way to reduce supplier lead time as well as stock holding cost. By setting up a VMI agreement with supplier, the company can significantly reduce its lead time
CONCLUSION
This study was carried out to discover how safety stocks can be used to mitigate the demand and lead time uncertainties of the cable inventory of ABC (Pvt) Ltd and thereby how it can be used to improve the delivery performances of the company. The study also determined an appropriate level of safety stock for a randomly selected sample of wire materials of ABC (Pvt) ltd.
However, setting the correct levels of safety stock is tricky and requires a thorough understanding of its drivers. The result of the study has shown that demand variability has the highest impact on delivery performances of the company. This variability in demand affects the material availability of the company, because of the long lead time of wire materials. But adhering to customer demand changes is also important for the survival of the cable harness section, since it is dominated by one large customer which accounts for nearly 75 percent of the total sales of that section.
Even though safety stock provides a protection against the demand and lead time uncertainty it also incurs a cost to the company. But there are long term alternatives to mitigate the variability other than the safety stock. But it is not possible to reduce the safety stocks to zero. If the company sets their safety stock to zero there level of inventory will go down as well as their service level costing them much more than the cost of some extra inventory. Therefore, it is important to understand the relationship between safety stock and service level to effectively reduce inventory without reducing the service level.
REFERENCES
- Becker, J., hartmann, W., Berstch, S., Johannes, N., Schemidt, M. (2013), Dynamic safety stock calculation. International journal of mechanical, aerospace, industrial and manufacturing management, 7, (10).
- Bhonsle, A., Rossitti, M., & Robinson, D. (2005). Identifying and Setting Safety Stocks Levels via Multiple Criteria. Paper presented at the 2005 Industrial Engineering Research Conference. Atlanta, GA: Institute of Electrical and Electronics Engineers
- Celik, C. (2003). Optimizing safety stock level in a manufacturing company. University of Cantabria, Spain
- Chopra, S., Reinhardt, G., & Dada, M. (2004). The Effect of Lead Time Uncertainty. Decision Sciences, Volume 35 Number 1
- Graves, S. C. (1987), Safety stocks in manufacturing systems. A.P. Sloan scool oh management, Cambridge.
- Hopp, W. J. & Speraman, M. L. (2008). Factory Physics (Third Edition). United Sates of America: Waveland Press, Inc.
- Jung, J.Y., Blau,G.,Pekeng, J.F., Rekltis, G.V., Everdyks, B. (2008). Intergrated safety stock management for multi stage supply chains under production capacity constraints. 32, 2570-2581.
- King, P. L. (2011, August). Crack the code: understanding safety stock and mastering its equations. APICS magazine, p. 33-36
- Maia, L.O.A., Qassim, R.Y. (1998) Minimum cost safety stock for frequent delivery manufacturing, 62, 233-236.
- Simchi Levi, D. & Simchi Levi, E. (2007) Designing and managing the supply chain (Second Edition)
- Trater, L.F. (2009). Minimizing inventory cost by properly choosing the level of safety stock. Economic and business review, 11, 109-117.
- Water, C. D.J. (2003). Logistics: An introduction to supply chain management. New York: Palgrive Macmillan
- Yano, C.A., Carlson, R.C. (1987). Safety stock for assembly system with fixed production interval (Tech. Report no 87.7)
APPENDIX A: Supply chain of cable harness section
Cable harness section of the ABC is dominated by one large customer. Therefore this section will briefly explain the supply chain of the main customer of the cable harness section.
- Sales
Project and sales department controls all ABC’s activities for the customer. There is a dedicated project manager for the customer and he is responsible for the smooth handling of all activities on behalf of the customer. This customer has several manufacturing facilities, and ABC Sri Lanka produce cable harnesses for their Mexico and Austria facilities. Annual sales are nearly around USD 4.5 Mn from the main customer. And this number will greatly increase in the coming years, because Mexico and Austria facilities have selected ABC as their main suppliers and they are now in the process of transferring products from their other suppliers to ABC. Also their Canada facility is now in the process of considering of transferring their products to ABC, and they are still at the quotation stage. With all these new orders, the company is expecting nearly USD 10 Mn sales from this customer.
Currently, the company is producing 15 different types of harnesses for this customer. Therefore production of the cable harness section can be categorized as low mix low volume production and all the orders are made to order production. Production quantities vary from 500 to 2000 harnesses.
With the main customer, the company has a scheduling agreement. Under the scheduling agreement they give the forecast for one year period of time at the beginning of each year. Also the customer has three months frozen period. Out of the three months, four weeks are allocated as production lead time and six weeks as shipping time. Based on the scheduling agreement, planned orders are released to the system and based on the production lead time planned orders are converted into production orders. Within the four weeks of production lead time, the customer cannot change their orders, if they do so it has to be done at the customers cost. Out of the four weeks time, the customer can change the orders and they are not bind outside the frozen zone. Customer sends a forecast every two weeks in addition to the forecast given at the beginning of the year. Based on the forecast received every two weeks, planned orders may change accordingly.
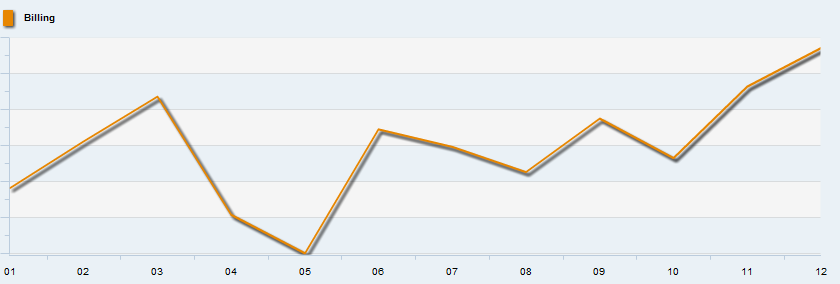
Demand of the main customer takes a cyclical pattern.( Figure 9 shows you the demand of the main customer during 2015.) Y axis shows the months and the x axis shows the volume during 2015. Demand is low during the months of April and May, and demand rises to its peak during December. This pattern has been continued in 2015 as well as it is continuing in 2016 as well.
Figure 9: Demand pattern of the main customer- 2015
- Procurement
There is dedicated procurement team for this customer. Materials can be procured only from the qualified suppliers. Based on the customer orders, system automatically creates purchase requisitions and based on the purchase requisitions procurement team place purchase orders to raw material suppliers.
Since the company is having a scheduling agreement with the customer, purchaser place production orders for forecasted demand as well. With the high lead times, purchasers cannot procure only for the realized demand. Therefore they order for both realized as well as forecasted demand based on the lead time. But the forecasted demand tends to vary since they are outside the frozen zone. And the result would be either stock outs or having extra stocks. Currently ABC has not defined a safety stock for raw materials of the cable harness section. Recently, the company has implemented a two bin KANBAN system for the raw materials of cable harness section
- Planning
Planning department is releasing production orders within the frozen time (One month) based on the customer demand and due dates.
- Production
Currently, cable harness section is having a capacity of nearly 600 harnesses per day and it currently employees 120+ productive employees. Orders are shipped to customer twice a week, Tuesday and Friday. Sea shipments are used to deliver goods to customers. But in the case of being unable to meet the customer due dates, ABC use air shipments at the cost of the company.
APPENDIX B: RPN Calculation
Bhonsle, Rossitti & Robinson (2005) have developed a model for determining appropriate service level for different product based on demand fluctuation, lead time and internal criticality. For each variable they have compute a Risk Priority Number by multiplying the three scores of each item and get an appropriate service level
This model uses three criteria to determine RPN. They are,
- Demand Fluctuation is the coefficient of variation of demand for an item over a period of one year, using either weekly or monthly time buckets.
- Supplier responsiveness is merely the lead time for each item
- Internal criticality is the only subjective criterion that has developed by using inputs from planning, production and engineering functions. It is based on the requirement of the item when the production or assembly process of an order begins. If the item is required to begin production or assembly then there is a high risk associated with going out of stock.
Each of these criteria has given a score from 1 to 9 based on the level of severity.
Table 9: DFS, SRS and ICS scores
| CV of demand | Demand fluctuation score (DFS) | Lead time | Supplier responsive score (SRS) | Criticality | Internal criticality score (ICS) |
| .00-0.2 | 2 | 1 | 1 | Very low | 1 |
| 0.21-0.4 | 3 | 2 | 2 | low | 3 |
| 0.41-0.6 | 4 | 3 | 3 | medium | 5 |
| 0.61-0.8 | 5 | 4 | 4 | high | 7 |
| 0.81-1.0 | 6 | 5 | 5 | Very high | 9 |
| 1.01-1.2 | 7 | 6 | 6 | ||
| 1.21-1.4 | 8 | 7 | 7 | ||
| >1.4 | 9 | 8 | 8 | ||
| >8 | 9 |
Source: Bhonsle, A., Rossitti, M., & Robinson, D. (2005). Identifying and Setting Safety Stocks Levels via Multiple Criteria. Paper presented at the 2005 Industrial Engineering Research Conference. Atlanta, GA: Institute of Electrical and Electronics Engineers
RPN= DFS x SRS x ICS
Table 10: RPN Score 7 Service Level
| RPN Range | Service level |
| <100 | 70% |
| 101-150 | 75% |
| 151-200 | 80% |
| 201-250 | 85% |
| 251-300 | 90% |
| >300 | 95% |
Source: Bhonsle, A., Rossitti, M., & Robinson, D. (2005). Identifying and Setting Safety Stocks Levels via Multiple Criteria. Paper presented at the 2005 Industrial Engineering Research Conference. Atlanta, GA: Institute of Electrical and Electronics Engineers
APPENDIX C: Production Leveling
Table 11: Production leveling schedule for Green category products for calendar week 20 to 30
| Material | Calendar Week | |||||||||||
| 20 | 21 | 22 | 23 | 24 | 25 | 26 | 27 | 28 | 29 | 30 | ||
| 9014057 | Customer orders | 0 | 320 | 960 | 0 | 640 | 0 | 640 | 0 | 960 | 0 | 640 |
| production orders | 590 | 370 | 640 | 690 | 340 | 570 | 640 | |||||
| 9015028 | Customer orders | 0 | 640 | 320 | 0 | 640 | 0 | 640 | 0 | 640 | 0 | 640 |
| production orders | 70 | 320 | 640 | 640 | 400 | 330 | 550 | |||||
| 9014056 | Customer orders | 0 | 0 | 320 | 0 | 640 | 0 | 0 | 0 | 640 | 0 | 320 |
| production orders | 320 | 330 | 310 | 640 | 100 | 220 | ||||||
| 9012864 | Customer orders | 0 | 0 | 320 | 0 | 320 | 0 | 0 | 0 | 320 | 0 | 320 |
| production orders | 290 | 30 | 320 | 320 | 320 | |||||||
| 9012867 | Customer orders | 0 | 0 | 320 | 0 | 320 | 0 | 320 | 0 | 320 | 0 | 320 |
| production orders | 320 | 640 | 320 | 430 | ||||||||
| 9014678 | Customer orders | 0 | 0 | 320 | 0 | 0 | 0 | 320 | 0 | 320 | 0 | 0 |
| production orders | 320 | 320 | 320 | |||||||||
| 9012865 | Customer orders | 0 | 0 | 320 | 0 | 0 | 0 | 0 | 0 | 320 | 0 | 0 |
| production orders | 320 | 320 | ||||||||||
| 9014367 | Customer orders | 0 | 320 | 0 | 0 | 320 | 0 | 0 | 0 | 320 | 0 | 0 |
| production orders | 320 | 310 | 10 | 320 | ||||||||
| 9015086 | Customer orders | 0 | 0 | 0 | 0 | 0 | 0 | 320 | 0 | 0 | 0 | 0 |
| production orders | 30 | 290 | ||||||||||
| 9014776 | Customer orders | 0 | 320 | 0 | 0 | 0 | 0 | 0 | 0 | 320 | 0 | 0 |
| production orders | 320 | |||||||||||
| 9015085 | Customer orders | 0 | 320 | 0 | 0 | 0 | 0 | 0 | 0 | 0 | 0 | 320 |
| production orders | 320 | 320 | ||||||||||
| 9014369 | Customer orders | 0 | 0 | 0 | 0 | 0 | 0 | 0 | 0 | 0 | 0 | 0 |
| production orders | ||||||||||||
Table 12: Total demand for green stream products between calendar weeks 20 to 30
| Calendar Week | |||||||||||
| 20 | 21 | 22 | 23 | 24 | 25 | 26 | 27 | 28 | 29 | 30 | |
| Before leveling | 0 | 1,920 | 2,880 | 0 | 2,880 | 0 | 2,240 | 0 | 4,160 | 0 | 2,560 |
| After leveling | 1,300 | 1,400 | 1,300 | 1,620 | 1,620 | 1,620 | 1,620 | 1,290 | 1,290 | 1,290 | 1,290 |

One comment