
CHAPTER 1:
This chapter begins with an overview of the organisation and the employee effectiveness that resulting from employee engagement and the motivation. It further discusses the statement of the problem and the purpose of the study. The conceptual framework, limitations and assumptions of the research are also examined.
Overview
The level of commitment and the involvement an employee puts into his job, the awareness of his employer’s expectation from him and his willingness to offer his discretionary effort to do the jobs determines the level of the engagement in any given company.
Many researches revealed that there is a direct relationship between employee commitment and organisation performance when employees are enthusiastically engaged through motivation. A research was carried out by Corporate Leadership Council in April 2007 and publicized that increasing the engagement level of an employee positively resulted in uplifting company performance by 20% and 87% of the employees are less likely to leave the organisation. The probability of departure is very less and it indicates the significance of engagement and how it impact on organisational performance.
There are plenty of grounds why employers might not have a healthy relationship with their employees. One of the major reasons include financial crisis which force the employer to withhold some of the employee beneficiary packages such as rewards, pay rise, bonuses and perks whereas some are encountering redundancy.
The concept of engagement is presented by four major approaches in the academic circles and they are:
- Burnout-antithesis approach (Maslach et al 2001)
- Need satisfying approach (Kahn 1990)
- Satisfaction-engagement approach (Harter et al 2002) and
- Multidimensional approach (Saks 2006). Even though these four approaches are quite not alike, on the contrary they contribute for a depth understanding of employee engagement.
There are number of researches who witnessed that engaged employees help the companies to reap benefits such as highest efficiency, higher customer satisfaction and loyalty and higher productivity that lead to an outstanding performance and success (Harter et al 2002). The existing literature and study suggests that the end product of employee engagement are precisely what the companies wanting for as it delivers greater return on assets, more profits and higher shareholder value (Macey 2008).
Employee engagement in the manufacturing and resale sector is very rarely demonstrated and the concepts are poorly misunderstood, even though some play a significant role in health and safety, dealing with lives and future (Merrills and Fisher 2006).
The condition at ABC (Pvt)Ltd manufacturing and resale s is quite different and the leadership of the company illustrates their employees as their biggest asset, and they are so dedicated by building and enabling a friendly environment for their employees to attain their fullest potential. The company has outlined number of ways in terms of engaging and motivating the employees which lead to augment the overall performance but failed. In many occasions, instead of management asking the employees regarding their needs and engagement levels, conversely they organise workshops and conduct surveys without acting or giving solution for the issue arises from surveys. This approach does not create value or meaning for employees but relatively perceived as insincere. At first, the researcher structured to see the present level of employee engagement. Secondly, it has designed to dispense questionnaires which will plot a route. Thirdly, the recommendation to construct an enthusiastic employee engagement. Literature on engagement expresses plenty of factors that influence the employee engagement at work place, those influencing factors will be scrutinized which factors require to be developed so as to increase the employee engagement.
Problem Statement
Engagement of employee has become a well known managerial concept in during the past couple of decades. Organisations use different techniques to construct an effective engagement in order to stay competitive and develop the performance. The employees feel tight bond with the organisations, when the engagement is very effectual and true. The objective of the research is to add some value to the researches on the engagement of employees within the manufacturing and resale industries as it has been rarely studied and demonstrated, even though these employees play a significant role in daily performance and influence the overall performance of the business.
Research Question
The research questions were narrowed down to below five and deemed to be most significant:
- Does the employee motivation have a direct link with the performances?
- Does the employee engagement have a link with the performances?
- What are the motivational factors that influence the employee engagement?
- What are the motivational theories that the organisation can use to motivate the employees?
- Do the employee performances can be monitor, related to these factors?
The research methodology will have quantitative and qualitative as well as primary and secondary data will be acquired. This research will help the company leaders to see where their lacking engaging the employees and highlight the areas for improvement. The end results will give a worthwhile recommendation to ABC (pvt) Ltdmanufacturing and resale s with regards to the tools and techniques to be applied for an enthusiastic engagement that ultimately enhance the company overall performance.
Research Objectives
The following are the objectives of this research:
- To synthesis the literature on enhancing organisational performance.
- To establish employee engagement levels and classify them.
- To identify the impact of engaged and disengaged employees on organisational performances.
- To determine the level of engagement and how it impacts the organisation.
- To develop affiliation among motivation, employee engagement and organisational performance.
- To recommend the techniques to enhance the enthusiastic engagement and performance.
Significance of Thesis
It has claimed that highly engaged employees make a substantive contribution to their organisations and they clear the route for success (Saks 2006).However the reverse holds true as well. The disengaged employees considered to be rigorous liability for the company. The employee’s disengagement compares to a cancer which can gradually corrode the organisation (Ayers 2006). It is further argued that employee retention, customer satisfaction, loyalty and productivity are will be at jeopardise unless the disengagement could be eliminated.
Unfortunately, the existing studies express that employees are not engaged with their work in general. A consulting firm recently conducted a survey in US and found that job satisfaction and engagement level are scored poorly with all major classes of job in US market; half of the respondents rated themselves as highly engaged (Frauenheim 2006).The poor percentage of employee engagement fractures all the organisations throughout the world, it deserve preventable costs and finally generate customer dissatisfaction. Meantime the disengagement can wobble the finance strength of the company (Rampersad 2006).
Employee engagement is one of the top five most significant challenges faced by the management team, as per the survey of 656 CEO’s in western and developed countries (Wah 1999). Considering and taking into account that employees in manufacturing and resale industries are infrequently researched group of employees and now this twofold challenge for the management of ABC (Pvt)Ltd manufacturing and resale . Thus, this study will also supply some specific characteristic of the employees such as their interests, mind sets, behaviours and work-life perception, so it is convenient to generate the suitable engagement tools. In addition to that empirical study will emphasise the present level of engagement and discover the buffering factors for an effective engagement.
CHAPTER 2:
LITERATURE REVIEW
2.1Employee Engagement Overview
Employee engagement is all about how individuals perform at workplace, the commitment level and the attachment a member of staff has towards the company he or she working for. It is the degree to which workforce make out what is exactly expected from them and their willingness to utilise their discretionary efforts to meet the jobs. This distinguish between the employees coming to work and just doing their jobs and employees coming to work eagerly with creativity to dispense the productivity (Loehr and Schwartz 2003).
‘There is a clear relationship between level of engagement of employee and customer focus, financial facets and operational performance’(Towers 2004, p2). Thus, employees’ endeavours must be harnessed in order to improve this performance. If employees are performing at their top of their potential, the companies will be more productive and successive. This will positively impact on excellent customer services, unnecessary waste elimination, enrich efficacy and ultimately enhance the organisational performance.
2.2 Significance of Engagement
The organisations have to motivate their employees. Once they are inadequately motivated, employees are incapable to commit to aims and objectives. Thus, it is vital for the managers to construct an enthusiastic engagement at workplace. The companies that are built with engaged workforces will undeniably reap the benefits of customer satisfaction, employee loyalty, employee enthusiasm, employee retention and profitability.
2.2.1.2 Health & Comfort
There are researches that present a theme of employee engagement can be result in a positive health and optimistic feeling towards the company and work life itself (Mauno et al 2007). Gallup organisation quoted that augmented health in engaged employees, 62% of engaged employees reported that work positively influences their physical health (cited in Lockwood 2007).
2.2.2 Organisational Effects
2.2.2.1 Organisational Performance
There are evidence from numerous studies that witnessed and supported the relation between employee engagement and organisational outcomes. Studies and researches have revealed that engagement of employee have positive impact on the following indicators of organisational performance: profitability (Harter et al 2002, Salanova et al 2005 and Schaufeli et al 2002), employee turnover (Harter et al 2002, Hallberg and Schaufeli 2006), productivity (Harter et al 2002, Salanova et al 2005), customer satisfaction (Towers Perrin 2003, Heintzman and Marson 2005) and protection (Harter et al 2002).
2.2.2.2Retention of Employee
Chart
Figure 1 – Retention of Engaged 2012
Source: BlessingWhite (2015)
Figure 2 – Retention of Disengaged 2012
Source: BlessingWhite (2015)
According to the surveyed results in chart 1, 81% of the engaged employees have no plans to leave the organisation and intend to stay. It is quite perplexing so why that 2% of the engaged employees want to quit their job. Conversely in chart 2, 23% of the disengaged employees intend to remain. Researcher thinks there are many factors that influence the enthusiastic engagement and will be discussed in detail with recommendation in nearing chapters.
2.2.2.4Employee Productivity
Employee engagement influences the performance of the employee (Kahn 1990).Sonnentag (2003) established that high level of engagement assists the workers in acquiring initiative and following learning objectives. This is further supported by Lockwood (2007) quoting, engaged ones develop knowledge, go extra mile to help company, react to opportunities and engage themselves in guiding and helping. Engaged members are not only energetic, but also they enthusiastically employ their energy at job. Moreover they are rigorouslyengaged in their duty and give attention to the particulars (Bakker and Leiter 2010). Many researchers declare, engaged employees perceive the real meaning in their employment (Kahn 1990). If employees are unable to perceive the meaning in their job, they more likely to isolate from their duty, in other terms they happen to to be less committed (Aktouf 1992).
2.3 Drivers of Employee Engagement
Robinson demonstrates that the ‘strongest engagement driver is a common sense of emotionesteemed and involved’ (Robinson 2004, p22), and its mechanismrelated to engagement comprisesparticipation in decision making, opportunities for progression, and the company’s agonize for employee health and safety. He further claims that line manager equally has an imperative role to play in fostering employee’s value and involvement.
Globally 60% of the employees report that they are looking forward for more opportunities and willing to learn new things on a daily basis and intend to remain seated in their present organisation (BlessingWhite 2015). Sturdy employee-manager relationship is an essential element in employee engagement and sustain.
According to Hay Group, the manager should perform the below listed things in order to construct a highly engaged team and they are;
- Empowerment
- Promote and encourage teamwork with collaboration
- Career development and growth
- Being supportive, rewards and recognition whenever required
- Align activities with strategy
Company leaders have to be aware of their significance because they are role models and inspirational leaders, rather than just carrying their job title and doing nothing relevance.
Institute for Employment Studies (IES) diagnostic tool illustrates that performance appraisal and training are vital for employees so that they valued, involved and consequentlyengaged. Maslow’s hierarchy of needs and Herzberg’s theories that quotes reward and recognition and performance appraisal are the fundamentals to drive the engagement, is well supported by the below IES tool.
I m p o r t a n c e
Training, development & career
Immediate management
Performance & appraisal
Communication
Equal opportunities & fair treatment
Pay & benefits
Health & safety
Co-operation
Family friendliness
Job satisfaction
Feeling valued & involved
Engagement
Figure 3 – IES Diagnostic Tool
Source: Robinson 2004, IES Survey
It widely accepted that the utmost impact on discretionary effort comes from how employees value and enjoy their occupation and the company. This is recognized as the emotional obligation and can be demonstrated further using the diagramgiven by the Corporate Leadership Council’s (CLC) engagement model.
Two Commitment Types
Four Focal Points of
Commitment
Outputs of Commitment
Performance
Retention
Discretionary Effort
Employee willingness to go above and beyond the call of duty, such as helping others with heavy workloads, volunteering for additional duties and looking for ways to perform the job more effectively
Intend to Stay
Employee desire to stay with the organisation based on whether they intend to look for a new job within a year, whether they are actively looking for a job, or have begun to take tangible steps like placing calls or sending out resumes
Rational Commitment
The extent to which employees believe that managers, teams or organisation have their self-interest in mind (financial, development, or professional)
Emotional Commitment
The extent to which employees value, enjoy and believe in their jobs, mangers, teams, or organisations
Day-to-Day Work
Team
Direct Manager
Organisation
![C:\Users\BUSINESS\AppData\Local\Microsoft\Windows\Temporary Internet Files\Content.IE5\WQJ5PIHU\MC900440379[1].png](https://myassignment.lk/wp-content/uploads/2019/07/c-users-business-appdata-local-microsoft-windows-.png)
Figure 4 – CLC Engagement Model
Source: CLC, Employee Engagement Survey & Analysis Tool (ESAT)
CHAPTER 3:
RESEARCH DESIGN AND METHODOLOGY
3.1 Introduction
This chapter will mainly pitch on research design and methodology. It presents the sketch of researcher’s approach to the study and sustain the attestation of the findings. This chapter revolves around: the research type and measures (self administered questionnaire and structured interviews). This chapter accentuates confidentiality to certain extend to safeguard.
The subsequent segment cover the approach and method used to gauge the existing engagement level of the personnel at ABC (Pvt)Ltd and the factors to be employed in order to construct and enhance an enthusiastic engagement that uplift the organisation productivity.
The survey technique considered to fit this researchwell, as the rationale of this research is explanatory and exploratory of individual personnel and the main focus being engagement of employee.
The researcher has presented and adopted his own pentagon model (figure 6) below for the research process.
Research Methodology
Sample
Data Collection
Biasness
Data Types
RESEARCH PROCESS
Figure 5 – Research Process Pentagon Model
Source: Researcher (2015)
3.2Methodology
There are three necessary ingredients of any research design and follows as:
- The research design is able to choose the source of information and kind of information to be used in order to answer the research question,
- The research design functions as a framework to identify the connection between the variables of research, and
- The research design supports in delineating the stages in the procedure from hypothesis to the data analysis (Cooper and Schindler 2003).
According to Bryman and Bell (2007) the ethical researchers possess a tendency to cluster their findings into two major groups and they are moreover quantitative research or qualitative research.
3.2.1Distinguish the Traits of Quantitative and Qualitative
| Question | Qualitative | Quantitative |
| The purpose of the research? | To explain & predict To verify & validate To test theory | To describe & explain To explore & interpret To build theory |
| The nature of the research? | Established guidelines Known variables Predetermined methods Somewhat context free | Holistic Flexible guidelines Emergent methods Context bound |
| What are the data’s & collection methods? | Numeric data Standardised instruments Representative, huge sample | Text/image based data Informative, small sample Loosely structured Non-standardised |
| How are the data analysed to determine their meaning? | Statistical analysis Stress on objectivity Deductive reasoning | Search for themes Inductive reasoning |
| How are the findings communicated? | Numbers Statistical aggregated data Formal voice, scientific style | Words Narratives, individual quotes Personal voice, literary style |
Table 1 – Traita between Qualitative & Quantative
Source: Bryman & Bell (2003)
3.2.3Qualitative Approach
Qualitative research ‘is concerned about participants’ perspective, on a daily basis practices and everyday knowledge referring to the concerns under study’ (Flick 2007). According to Denscombe (2010) qualitative research is concerned about diverse patterns of behaviours such as traditions, relationships, rituals and the way these are articulated.
Furthermore, qualitative method presents wording as empirical tool instead of presenting numbers. Quantitative research symbolise specific characteristics which are helpful for analytical uses. Such move expresses a sense of concrete, objective research (Marshall and Rossman 2006).
The qualitative method employed in interviews carried out among six managerial personnel throughout varied departments. The interviews taken place to unravel the complication surrounding engagement of employees.
3.3 Sample& Population
Population is a group of individual, items or an entity form in which samples are acquired to gauge (Coldwell and Herbst 2004). The purpose of this study to establish the aspects that promoting employee engagement and to what extend it is esteemed inmanufacturingand resale industry.The population of this study revolves around 165 personnel in ABC (Pvt)Ltd .
Interviews
Interviews were restricted to six managerial personnel within the six departments in order to obtain their departmental information in terms of employee engagement. It was an unrestricted and open-ended method to collect the qualitative.
Questionnaires
Questionnaires were submitted to the selected 60 participants and returned with exceptionally filled. Ranjit (1999) demonstrated that questionnaires may contain few potential problems interms of understanding and interpreting the questions by participants. But the researcher overwhelmed Ranjit’s suggestion by attending each participant individually so as to dispense the same interpretation and the attempt was successful for researcher.
CHAPTER 4:
DATA ANALYSIS, FINDINGS AND DISCUSSION
4.1 Introduction
Chapter four investigates the collected data from respondents and figures the findings from the study. This chapter will illustrate the characteristics of the respondents in this research and findings used to scrutinize the research questions. Furthermore, this segment emphasises the employees’ perspective and contemplation on engagement of employee. The findings will certainly contribute to any organisation and contemporary corporate leaders with regards to enthusiastic employee engagement and how it impacts on enhancing organisational performance. The questionnaire has exploited to congregate the primary data and qualitative method employed in interviews. In addition, this chapter outlines whether employees of ABC (pvt) Ltdengaged or disengaged, motivated or de-motivated and factors to be improved for an effective engagement.
4.2 Sample Profile
As previously mentioned the data was congregated through both self-administered questionnaires and structured interviews. Questionnaires circulated to the sample frame of 60 employees and received responses from every single one. This section illustrates the information relating to personal details such as age, sex, level of education, marital status, job level, service period and monthly income collected through the questionnaire. Sample consisted of 60 Managerial, and Executive staff of ABC Company. Number of respondents was 60 yielding a response rate of 100%.
4.2.1 Composition of sample according to Gender Distribution.
| Gender | |||||
|---|---|---|---|---|---|
| Frequency | Percent | Valid Percent | Cumulative Percent | ||
| Valid | Male | 25 | 41.7 | 41.7 | 41.7 |
| Female | 35 | 58.3 | 58.3 | 100.0 | |
| Total | 60 | 100.0 | 100.0 | ||
Table 2- Gender Distribution of the Sample
Source: Survey Data, 2014
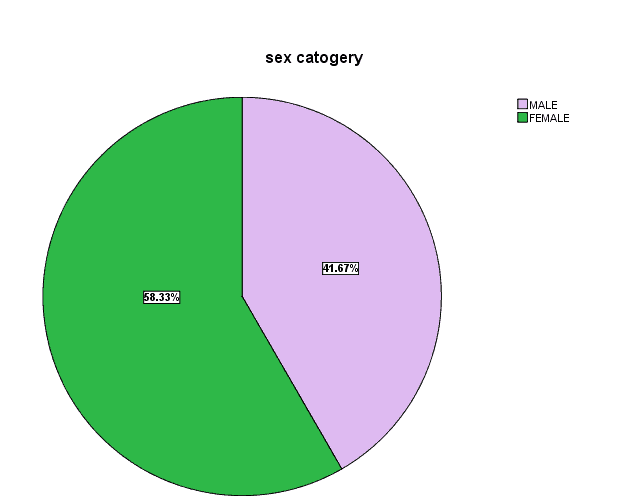
Figure 6- Gender Distribution of Sample
Source: Survey Data, 2014
According to above table and figure, Sample of this research consisted with 41.7% male employees and 58.3% female employees. The reason for this situation might be the high percentage of female staff in administrative division of the company. However, there are 25 male responders and 35 female responders and can be identified their level of work life balance.
4.2.2 Composition of sample according to Marital Status
| Frequency | Percent | Valid Percent | Cumulative Percent | ||
|---|---|---|---|---|---|
| Valid | single | 18 | 30.0 | 30.0 | 30.0 |
| married | 39 | 65.0 | 65.0 | 95.0 | |
| widow | 3 | 5.0 | 5.0 | 100.0 | |
| Total | 60 | 100.0 | 100.0 | ||
Table 3- Marital Status of Sample
Source: Survey Data, 2014
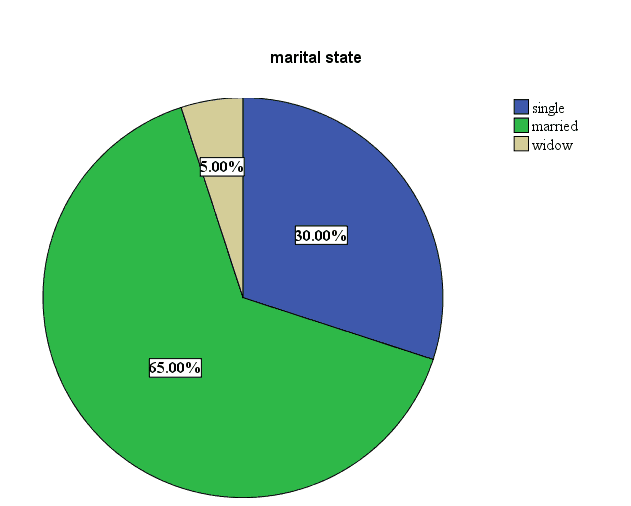
Figure 7- Marital Status of Sample
Source: Survey Data, 2014
As represented in above. large component is contributed by 65% (39) married responders ,30% ( 18) single responders and 5% (3)widow responders which supports to measure level of work life balance according to marital status of sample and to identify their difference in relation to level work life balance and employee out come.
4.2.3 Composition of sample according to Age Level
| Frequency | Percent | Valid Percent | Cumulative Percent | ||
|---|---|---|---|---|---|
| Valid | between 20-25 | 12 | 20.0 | 20.0 | 20.0 |
| between 26-30 | 14 | 23.3 | 23.3 | 43.3 | |
| between 31-35 | 7 | 11.7 | 11.7 | 55.0 | |
| between 36-40 | 13 | 21.7 | 21.7 | 76.7 | |
| between 41-45 | 7 | 11.7 | 11.7 | 88.3 | |
| more than 45 | 7 | 11.7 | 11.7 | 100.0 | |
| Total | 60 | 100.0 | 100.0 | ||
Table 4- Age Distribution of the Sample
Source: Survey Data, 2014
F
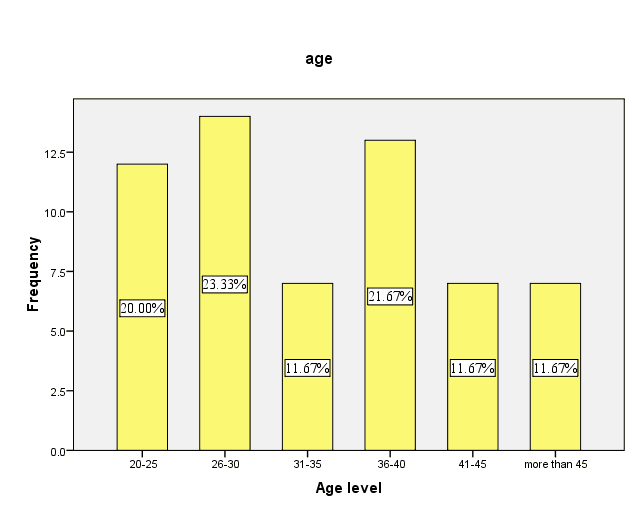
Figure 8- Age Distribution of Sample
Source: Survey Data, 2014
The Age group of sample is ranking from 20 – 25 to above 45 years. The majority of responders are belongs to 26-30 and above 45 year age group,41-45 age group and 31-35age groups represents the lowest percentage.20% of sample falls within the 20 -25 age group and 11.7% of sample falls within the 31-35 age group. 36-40 age group indicates the 21.7% of sample and 41-45 represents11.7% of the sample
4.2.4 Composition of sample according to working experience
| Frequency | Percent | Valid Percent | Cumulative Percent | ||
|---|---|---|---|---|---|
| Valid | less than 5 | 14 | 23.3 | 23.3 | 23.3 |
| between 5-10 | 19 | 31.7 | 31.7 | 55.0 | |
| between 10-15 | 17 | 28.3 | 28.3 | 83.3 | |
| between 15-20 | 7 | 11.7 | 11.7 | 95.0 | |
| more than 20 | 3 | 5.0 | 5.0 | 100.0 | |
| Total | 60 | 100.0 | 100.0 | ||
Table 5- Work Experience of Sample
Source: Survey Data, 2014
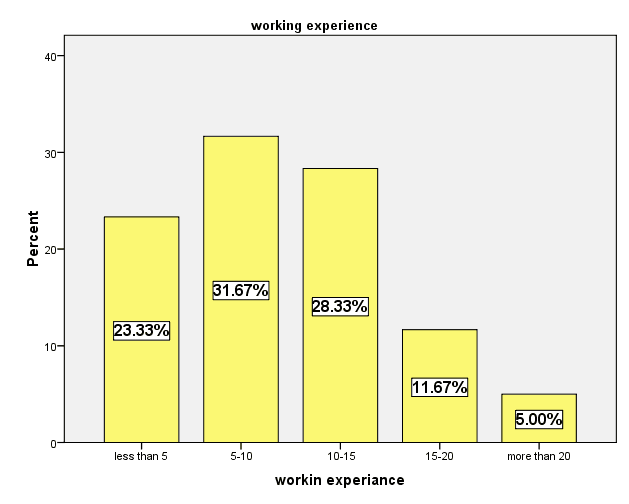
Figure 9- Work Experience of Sample
Source: Survey Data, 2014
The largest component of the sample represent by the responders who falls within the group of between 5-10 years working experience. The lowest percentage is represented by the responders who fall within the more than 20working experience groups, while 10-15working experience groups indicate 28.3% from the sample. Then the 11.7% and 23.3% of sample are falls within 15-20 and less than 5working experience group.
4.2.5 Composition of sample according to Income Level
| Frequency | Percent | Valid Percent | Cumulative Percent | ||
|---|---|---|---|---|---|
| Valid | Less than 25000 | 6 | 10.0 | 10.0 | 10.0 |
| Between 25000-35000 | 12 | 20.0 | 20.0 | 30.0 | |
| Between 35000-45000 | 13 | 21.7 | 21.7 | 51.7 | |
| Between 45000-55000 | 17 | 28.3 | 28.3 | 80.0 | |
| Above 55000 | 12 | 20.0 | 20.0 | 100.0 | |
| Total | 60 | 100.0 | 100.0 |
Table 6- Income Distribution of Sample
Source: Survey Data, 2014
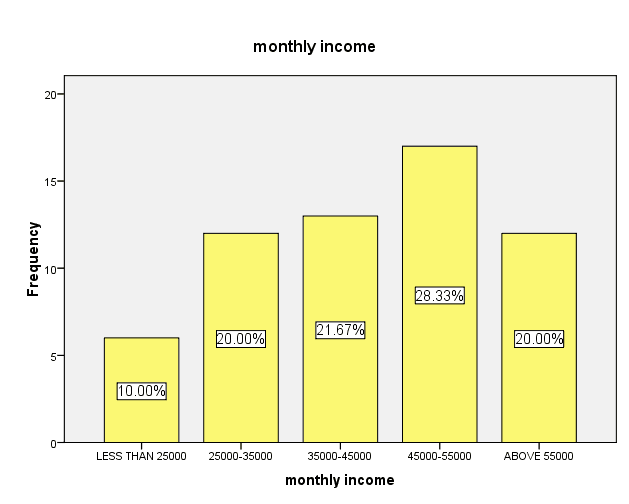
Figure 10- Income Distribution of Sample
Source: Survey Data, 2014
According to the above table & figure, highest number of respondents can be seen in the income level 45000-55000. It is shown 21.7% percentage of responders within the 35000-45000 income level. The lowest number of responders indicated by less than 25000 income level which is represented10% from the sample.
4.2.6 Composition of sample according to Department
| Department | Frequency | Percent | Valid Percent | Cumulative Percent | |
|---|---|---|---|---|---|
| Valid | HR | 9 | 15.0 | 15.0 | 15.0 |
| Production | 16 | 26.7 | 26.7 | 41.7 | |
| Marketing | 11 | 18.3 | 18.3 | 60.0 | |
| Finance | 13 | 21.7 | 21.7 | 81.7 | |
| Internal audit | 8 | 13.3 | 13.3 | 95.0 | |
| Other | 3 | 5.0 | 5.0 | 100.0 | |
| Total | 60 | 100.0 | 100.0 | ||
Table 7- Departmental Distribution of Sample
Source: Survey Data, 2014
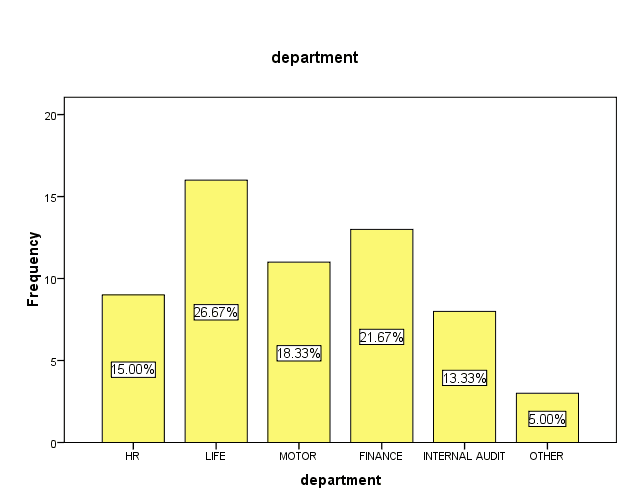
Figure 11- Departmental Distribution of Sample
Source: Survey Data, 2014
The Highest number of responders can be seen in the Production Department as it is the most convenience sample which indicates 26.7% from the sample. There are several other departments not mentioned it is 5% from the sample. In addition to that sample is consisted of 21.7% from Finance Department, Marketing Department18.3%, 13.3% from Internal Audit.
4.2.7 Composition of sample according to Highest Educational Qualification
| Frequency | Percent | Valid Percent | Cumulative Percent | ||
|---|---|---|---|---|---|
| Valid | up to O/L,A/L | 2 | 3.3 | 3.3 | 3.3 |
| professional qualification | 13 | 21.7 | 21.7 | 25.0 | |
| diploma | 12 | 20.0 | 20.0 | 45.0 | |
| degree | 22 | 36.7 | 36.7 | 81.7 | |
| masters degree | 6 | 10.0 | 10.0 | 91.7 | |
| other | 5 | 8.3 | 8.3 | 100.0 | |
| Total | 60 | 100.0 | 100.0 | ||
Table 8- Educational Distribution of Sample
Source: Survey Data, 2014
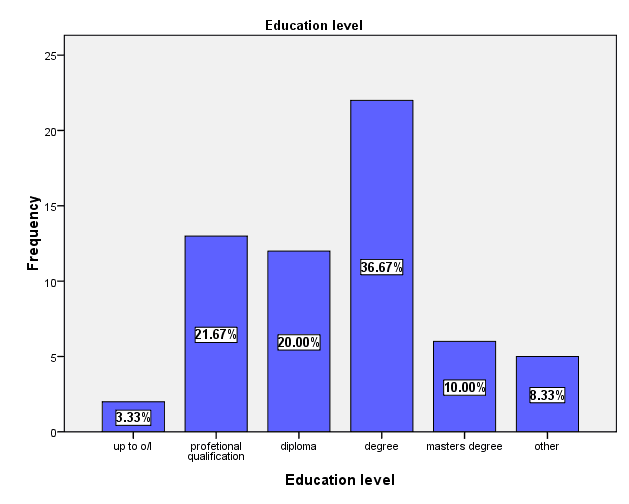
Figure 12-Educational Distribution of Sample
Source: Survey Data, 2014
According to the Table and Figure, majority of the sample have degrees and it represents 36.7% of the sample. The 3.3% of lowest sample is indicated by up to O/L,A/L education level while master’s degree holders are indicating 10% from the sample. 20% of sample relates to responders who having Diploma and 21.7% are having professional qualification employees and 8.3% from the sample are having other qualifications.
4.2.8 Composition of sample according to job category
| job category | |||||
|---|---|---|---|---|---|
| Frequency | Percent | Valid Percent | Cumulative Percent | ||
| Valid | executive | 24 | 40.0 | 40.0 | 40.0 |
| senior executive | 14 | 23.3 | 23.3 | 63.3 | |
| assistant manager | 8 | 13.3 | 13.3 | 76.7 | |
| manager | 10 | 16.7 | 16.7 | 93.3 | |
| senior manager | 4 | 6.7 | 6.7 | 100.0 | |
| Total | 60 | 100.0 | 100.0 | ||
Table 9-Job Distribution of Sample
Source: Survey Data, 2014
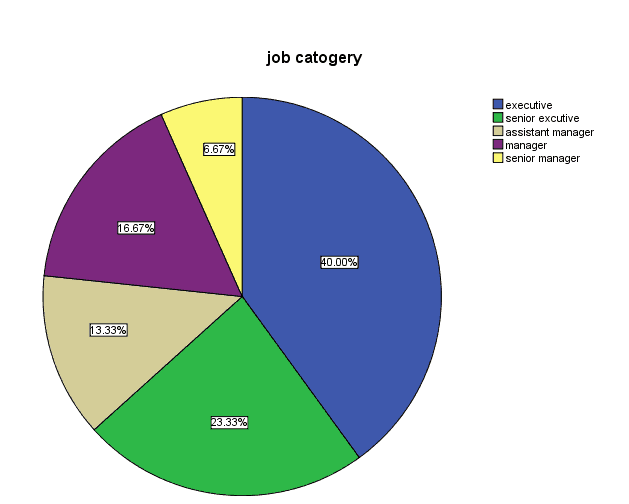
Figure 13-Job Distribution of Sample
Source: Survey Data, 2014
This sample includes only executive and managerial level employees. Among highest number of despondence is executive it represent 40% of sample, 23.3%senior executives,13.3% of sample include assistant managers,16.7% of sample include managers and6.7% of sample consisted by senior managers.
4.2.9 Composition of sample according to Respondents’ Age and Gender.
| Age | Gender | Total | ||
|---|---|---|---|---|
| Male | Female | |||
| age | between 20-25 | 6 | 6 | 12 |
| between 26-30 | 7 | 7 | 14 | |
| between 31-35 | 1 | 6 | 7 | |
| between 36-40 | 5 | 8 | 13 | |
| between 41-45 | 3 | 4 | 7 | |
| more than 45 | 3 | 4 | 7 | |
| Total | 25 | 35 | 60 | |
Table 10- Composition of Age and Gender of Sample
Source: Survey Data, 2015
According to the above figure 7 male responders are belongs to 26-30 age group and majority of the female responders falls 36-40 age group within it by 8 responders. The lowest number of male employees are belongs to 31-35age level .while 3 male employees and 3 female employees are belongs to more than 45 years age group as well as the lowest number of female responders also fall within that age group and 41-45 age group. It is shown equal portion of both male and female employees regarding 20-25age group.
4.2.10 Composition of sample according to respondents’ working experience and Position
| job category | Total | ||||||
|---|---|---|---|---|---|---|---|
| executive | senior executive | assistant manager | manager | senior manager | |||
| working experience | less than 5 | 6 | 2 | 3 | 3 | 0 | 14 |
| 5-10 | 8 | 4 | 2 | 3 | 2 | 19 | |
| 10-15 | 5 | 6 | 2 | 3 | 1 | 17 | |
| 15-20 | 3 | 2 | 0 | 1 | 1 | 7 | |
| more than 20 | 2 | 0 | 1 | 0 | 0 | 3 | |
| Total | 24 | 14 | 8 | 10 | 4 | 60 | |
Table 11- Distribution of Work Experience and Position of Sample
When comparing the working experience and the position of respondents, Majority of Managerial and executive level employees “working experience falls within “between 5-10 years “group. the lowest number of managerial responders are belongs to working experience group “more than 20 years group “ while Lowest number of Executives are indicate .
4.2.11 Composition of sample according to Respondents’ position and Income level
| monthly income | Total | ||||||
|---|---|---|---|---|---|---|---|
| Less than 25000 | 25000-35000 | 35000-45000 | 45000-55000 | Above 55000 | |||
| job category | executive | 6 | 12 | 5 | 1 | 0 | 24 |
| senior executive | 0 | 0 | 6 | 8 | 0 | 14 | |
| assistant manager | 0 | 0 | 2 | 6 | 0 | 8 | |
| Manager | 0 | 0 | 0 | 2 | 8 | 10 | |
| senior manager | 0 | 0 | 0 | 0 | 4 | 4 | |
| Total | 6 | 12 | 13 | 17 | 12 | 60 | |
Table 12- Distribution of Position and Income Level of Sample
According to above Table, the largest component of the sample represented by Executive grade employees and majority of them falls within the 25000-35000 income level. 4 senior Managerial employees indicate 55000 or above income level and most of the senior executive employees are falls within 45000-55000 income level. Thus, the largest component of the lowest income level (less than 25000) is represented by executive employees. 35000-45000 income level is indicated by 1 executive responder, 8 senior Executive level responders and 6managerial grade responders. 25000-35000income level is represented by 12Executive level employees,
4.3 Descriptive Analysis
This chapter analyses responses given by responders to every question which represent both dependent and independent variables. Questionnaire consists of set of well-formulated questions to probe and obtain responses from respondents. Here, it concerns level of every response and work life balance and outcome level of employees. All the responses are based on five point likert scale and standards are weighted as follows.
Standard Weighted Value
Strongly agree 5
Agree 4
Average 3
Disagree 2
Strongly disagree 1
4.3.1 Mean and Standard Deviation of Work Life
| Descriptive Statistics | |||||
|---|---|---|---|---|---|
| N | Minimum | Maximum | Mean | Std. Deviation | |
| work place culture | 60 | 2.00 | 4.00 | 3.3375 | .684 |
| Valid N (listwise) | 60 | ||||
Table 13- Mean and Standard Deviation of Work Culture
When considering the Mean value of respondents answers it shows 3.3375 which is very closer to the high level work place culture. That means there is work place culture of ABC employees. The standard deviation of responses given on work place culture is 0.684. Standard deviation shows how much variation or dispersion there is from the average (mean or expected value). A low standard deviation indicates that the data points tend to be very close to the mean, whereas high standard deviation indicates that the data are spread out over a large range of values. All these statistical data indicates that the respondents are good level of work place culture adopted by Tire House.
4.3.2 Mean and Standard deviation of level family and social life
| Descriptive Statistics | |||||
|---|---|---|---|---|---|
| N | Minimum | Maximum | Mean | Std. Deviation | |
| family | 60 | 2.00 | 4.25 | 3.3333 | .70473 |
| Valid N (list wise) | 60 | ||||
Table 14-Mean and Standard Deviation of Social Life
When considering the Mean value of respondents’ answers it shows 3.3333which is very closer to the high level of family and social life. That means level of family and social life of ABC employees is in a high level. The standard deviation of responses given on level of family and social life is. 0.70473. Standard deviation shows how much variation or dispersion there is from the average (mean or expected value). A low standard deviation indicates that the data points tend to be very close to the mean, whereas high standard deviation indicates that the data are spread out over a large range of values. All these statistical data indicates that the respondents are high level of family and social life adopted by Tire House.
4.3.3 Mean and Standard deviation of work life balance level
| Descriptive Statistics | |||||
|---|---|---|---|---|---|
| N | Minimum | Maximum | Mean | Std. Deviation | |
| Work life balance | 60 | 2.00 | 4.12 | 3.3354 | .68793 |
Table 15- Mean and Standard Deviation of Work Life Balance
Source: Statistical Data, 2014
When considering the Mean value of respondents answers it shows 3.3354which is very closer to the high level of work life balance. That means work life balance level of ABC employees is in a high level. The standard deviation of responses given on work life balance is .68793. Standard deviation shows how much variation or dispersion there is from the average (mean or expected value). A low standard deviation indicates that the data points tend to be very close to the mean, whereas high standard deviation indicates that the data are spread out over a large range of values. All these statistical data indicates that the respondents are high level of work life balance adopted by Tire House.
4.3.4 Mean and Standard deviation of employee commitment
| Descriptive Statistics | |||||
|---|---|---|---|---|---|
| N | Minimum | Maximum | Mean | Std. Deviation | |
| commitment | 60 | 2.40 | 4.40 | 3.3533 | .58394 |
| 60 | |||||
Table 16- Mean and Standard Deviation of Employee Commitment
Source: Statistical Data, 2014
When considering the Mean value of respondents’ answers it shows 3.3533which is very closer to the high level of employee commitment. That means employee commitment level of ABC employees is in a high level. The standard deviation of responses given on employee commitment is .58394. Standard deviation shows how much variation or dispersion there is from the average (mean or expected value). A low standard deviation indicates that the data points tend to be very close to the mean, whereas high standard deviation indicates that the data are spread out over a large range of values. All these statistical data indicates that the respondents are high level of employee commitment adopted by Tire House.
4.3.5 Mean and Standard deviation of employee job satisfaction
| Descriptive Statistics | |||||
|---|---|---|---|---|---|
| N | Minimum | Maximum | Mean | Std. Deviation | |
| JOB SATISFACTION | 60 | 2.47 | 4.58 | 3.4947 | .64330 |
| N | 60 | ||||
Table 17- Mean and Standard Deviation of Job Satisfaction
Source: Statistical Data, 2014
When considering the Mean value of respondents’ answers it shows 3.4947which is very closer to the high level of employee job satisfaction. That means employee job satisfaction level of ABC employees is in a high level. The standard deviation of responses given on employee job satisfactionis0.64330. Standard deviation shows how much variation or dispersion there is from the average (mean or expected value). A low standard deviation indicates that the data points tend to be very close to the mean, whereas high standard deviation indicates that the data are spread out over a large range of values. All these statistical data indicates that the respondents are high level of employee job satisfaction adopted by Tire House.
4.4. Correlation Analysis
Correlation analysis was used to identify relationships among dependent variable and independent variables. This section refers to analyze certain relationships between work life balance and other variables separately.
4.4.1. Correlation between work place culture and employee commitment
| Correlations | |||
|---|---|---|---|
| work place culture | commitment | ||
| work place culture | Pearson Correlation | 1 | .769** |
| Sig. (2-tailed) | .000 | ||
| N | 60 | 60 | |
| commitment | Pearson Correlation | .769** | 1 |
| Sig. (2-tailed) | .000 | ||
| N | 60 | 60 | |
| **. Correlation is significant at the 0.01 level (2-tailed). | |||
Table 18- Correlation Between Work Place Culture and Employee Commitment
Here, correlation analysis was done to identify the relationship between work place culture and employee commitment. According to above figures The Correlation between work place cultureand employee commitment is 0. .769at a significant level of 0.01 which is indicating that there is a strong positive relationship between work place culture and employee commitment. At the beginning, researcher expected that there is no significant relationship between work place culture and employee commitment. Accordingly, the researcher can reject the null hypothesis while accepting the alternative hypothesis.
4.4.2. Correlation between work place culture and employee job satisfaction
Here, correlation analysis was done to identify the relationship between work place culture and employee job satisfaction. According to above figures The Correlation between work place cultureand employee job satisfaction is 0.628at a significant level of 0.01 which is indicating that there is a strong positive relationship between work place culture and employee job satisfaction. At the beginning, researcher expected that there is no significant relationship between work place culture and employee job satisfaction. Accordingly, the researcher can reject the null hypothesis while accepting the alternative hypothesis.
4.4.3. Correlation between level of family and social life on employee commitment
| Correlations | |||
|---|---|---|---|
| family | commitment | ||
| family | Pearson Correlation | 1 | .851** |
| Sig. (2-tailed) | .000 | ||
| N | 60 | 60 | |
| commitment | Pearson Correlation | .851** | 1 |
| Sig. (2-tailed) | .000 | ||
| N | 60 | 60 | |
| **. Correlation is significant at the 0.01 level (2-tailed). | |||
Table 20- Correlation between Social Life and Employee Commitment
Here, correlation analysis was done to identify the relationship between level of family and social life on employee commitment. According to above figures The Correlation between level of family and social life and employee commitment is 0.851at a significant level of 0.01 which is indicating that there is a strong positive relationship between level of family and social life and employee commitment. At the beginning, researcher expected that there is no significant relationship between level of family and social life on employee commitment. Accordingly, the researcher can reject the null hypothesis while accepting the alternative hypothesis.
4.4.4. Correlation between level of family and social life on employee job satisfaction
| Correlations | |||
|---|---|---|---|
| family | JOB SATISFACTION | ||
| family | Pearson Correlation | 1 | .741** |
| Sig. (2-tailed) | .000 | ||
| N | 60 | 60 | |
| JOB SATISFACTION | Pearson Correlation | .741** | 1 |
| Sig. (2-tailed) | .000 | ||
| N | 60 | 60 | |
| **. Correlation is significant at the 0.01 level (2-tailed). | |||
Table 21- Correlation between Level of Family and Social Life and Job Satisfaction
Here, correlation analysis was done to identify the relationship between level of family and social life on employee job satisfaction. According to above figures The Correlation between work place culture and employee job satisfaction is 0 .741at a significant level of 0.01 which is indicating that there is a strong positive relationship between level of family and social life and employee job satisfaction. At the beginning, researcher expected that there is no significant relationship between level of family and social life on employee commitment. Accordingly, the researcher can reject the null hypothesis while accepting the alternative hypothesis.
4.4.5. Correlation between work life balance and employee commitment
| Correlations | |||
|---|---|---|---|
| Work life balance | commitment | ||
| Work life balance | Pearson Correlation | 1 | .818** |
| Sig. (2-tailed) | .000 | ||
| N | 60 | 60 | |
| commitment | Pearson Correlation | .818** | 1 |
| Sig. (2-tailed) | .000 | ||
| N | 60 | 60 | |
| **. Correlation is significant at the 0.01 level (2-tailed). | |||
Table 22- Correlation between Work Life Balance and Employee Commitment
Source: Statistical Data, 2014
Here, correlation analysis was done to identify the relationship between work life balance and employee commitment. According to above figures The Correlation between work life balance and employee commitment is 0.818at a significant level of 0.01 which is indicating that there is a strong positive relationship between work life balance and employee commitment.
4.4.6. Correlation between work life balance and employee job satisfaction
Correlation Analysis (2 – tailed test) was done in order to find whether there is a relationship between work life balanceand job satisfaction. According to the above table, Pearson Correlation coefficient(r) between above 2 variables is 0.692 at a significance level of 0.01 indicating a strong positive relationship between work life balance and job satisfaction. It can be observed that there is a stronger relationship between work life balance and job satisfaction.
4.5. Regression Analysis
Regression analysis is conducted to analyze several variables, when the focus is on the relationship between a dependent variable and one or more independent variables. Here the Regression analysis was conducted to determine the combined effect work life balance (Independent Variables) on the level of employee commitment of respondents (Dependent variable). The relationship among the above mentioned variables is shown by the below table
Table 5.21 regression between work life balance & employee commitment
| Model Summary | ||||
|---|---|---|---|---|
| Model | R | R Square | Adjusted R Square | Std. Error of the Estimate |
| 1 | .818a | .670 | .664 | .33856 |
| a. Predictors: (Constant), Work life balance | ||||
Table 24- Regression between Work Life Balance and Employee Commitment
Source: Statistical Data, 2014
Table 24 indicates that the multiple regression coefficients (R) of independent variables and level of employee commitment were 0. 818. R – Square was 0. 670 (67.0%) and the adjusted R – Square was 0. 664 (66.4%).
The analysis suggested that 66.4% of the variance (adjusted R – Square) in the level of work life balance of respondents has been explained by the independent variables. This is indicative of that; there is a strong joint impact from this independent variable on the level of employee commitment of staff of Tire House.
| Model Summary | ||||
|---|---|---|---|---|
| Model | R | R Square | Adjusted R Square | Std. Error of the Estimate |
| 1 | .692a | .478 | .469 | .46859 |
| a. Predictors: (Constant), Work life balance | ||||
Table 25- Regression between Work Life Balance and Job Satisfaction
Source: Statistical Data, 2014
Table 25 indicates that the multiple regression coefficients (R) of independent variables and level of employee job satisfaction were 0.692. R – Square was 0.478 (47.8%) and the adjusted R – Square was 0. 469 (46.9%).
The analysis suggested that 46.9% of the variance (adjusted R – Square) in the level of work life balance of respondents has been explained by the independent variables. This is indicative of that; there is a moderate joint impact from this independent variable on the level of employee job satisfaction of staff of Tire House.
| Model Summary | ||||
|---|---|---|---|---|
| Model | R | R Square | Adjusted R Square | Std. Error of the Estimate |
| 1 | .763a | .582 | .575 | .39400 |
| a. Predictors: (Constant), Work life balance | ||||
Table 26- Regression between Work Life Balance and Employee Outcome (Job Satisfaction and Employee Commitment)
Source: Statistical Data, 2014
Table 26 indicates that the multiple regression coefficients (R) of independent variables and level of outcome (job satisfaction and employee commitment)overall effect were 0.763. R – Square was 0.582(58.2%) and the adjusted R – Square was 0.575(57.5%).
The analysis suggested that 58.2% of the variance (adjusted R – Square) in the level of work life balance of respondents has been explained by the independent variables. This is indicative of that; there is a moderate joint impact from this independent variable on the level of employee outcome (job satisfaction and employee commitment) of staff of Tire House.
4.6. Summary
This chapter devoted to analyze the data collected from the survey. The survey data is presented & analyzed by using the SPSS 16.0 & the MS Excel. First it explained the Sample profile using Age, Gender, Educational Qualification, Marital status, Department, Job level etc. and then descriptive analysis was done through Mean, Standard Deviation, percentages of level of motivation etc. After that Correlation analysis was conducted to test the hypotheses. Final part of the chapter presents the Regression Analysis of the collected survey data.
CHAPTER 5:
CONCLUSION AND RECOMMENDATION
5.1 Introduction
This chapter presents the summary of the whole study and logical conclusions based upon the results derived in the previous section. In addition to that, this chapter discusses the recommendations, limitation of the study and suggestions for future researches.
5.2. Discussion of findings
This research study is mainly focused on measuring work life balance and employee outcomes; job satisfaction and organizational commitment of managerial employees in ABC Limited and extends the finding to reveal the impact of work life balance on employee outcomes.
- Based on the bivariate analysis between work life balance and employee commitment, the Pearson correlation is 0.818 suggesting that there is a strong positive relationship between work life balance and employee commitment which is significant at 0.01 level.
- This relationship is statistically significant as p< 0.01.( 0.00<0.01)
- The coefficient of determination (R2) of the regression model is 0.670. It is greater than 10% and shows an adequate level (R2>10%).
- So it can be concluded that 66.4% of variance in employee commitment is explained by level of work life balance.
- Based on the bivariate analysis between work life balance and employee job satisfaction, the Pearson correlation is 0.692 suggesting that there is a moderate positive relationship between work life balance and employee job satisfaction which is significant at 0.01 level (0.692).
- Significant value (0.000) is smaller than the desired level of significance(.0.01),the found correlation coefficient (0.692)is statistically significant (P<0.01).and also the coefficient determination (R2) of the regression model is 0. 469 and because it is greater than 10% (R2>10%) the model can be adequate. the adjusted R2 of the regression model is 0.469 (adjusted R2 = 0.469) indicating that 46.9 % of variance in work life balance in is explained by employee job satisfaction variable.
The findings of the research study support the existing empirical evidence that says there is a significant relationship between work life balance and employee outcomes; job satisfaction and organizational commitment.
According to previous research findings of Allen in 2001 emphasize that in a survey of a variety of occupations, employees who perceived their organizations as less family-supportive experienced more work-family conflict, less job satisfaction, less organizational commitment, and greater turnover intentions than those who perceived their organizations as more family-supportive.
finding provides some insight into the relationship between specific work life balance practices and organizational outcomes, an issue over which academics have called for further research to improve researcher understanding of how the effect of HR systems is produced
According to privies research by Bowen and Ostroff, in 2004 findings suggest that WLB information practices do not have a direct effect on results, but have an indirect effect on company outcomes by their impact on enhancing a positive culture towards WLB in the firm. They think that this is an important finding
The relationship between work life balance on employee commitment and employee job satisfaction who are work in ABC head office executive and managerial employees have been reviewed by the researcher and found that the method and techniques should be used to improve more than that
5.3 Conclusion
The main purpose of the research is to explore the relationship between work – life balance and employee outcomes (job satisfaction and commitment) of managerial employees in Tire House.
Using the data gathered from the head office of Tire House, Analysis was carried out with a view of providing empirical evidence on developed hypothesis.
Statistical evidence has proved that there is a significant relationship between work life balance and employee outcomes: Job satisfaction and organizational commitment.
| supervision | workload | Superior style | Satisfy with working hours | Availability of time spent with family | ||
|---|---|---|---|---|---|---|
| Mean | 2.95 | 3.57 | 3.53 | 2.95 | 2.95 | |
| Std. Deviation | .699 | .745 | .769 | .699 | .699 | |
| Variance | .489 | .555 | .592 | .489 | .489 | |
Table 27- Descriptive Statistics for Work Life Balance
Source: Statistical Data, 2014
Table 27 represents some indicators regarding work life balance. Conclusions that can be arrived by reviewing above facts are as fallows.
- According to table mean value of heavy work load indicator under work life balance is 0.357 and standard deviation is 0.813 indicating that there is no heavy work load and because of their jobs have been designed properly. And also there is adequate staffs when comparing the work load in Tire House.
- Mean value of training on work life balance issues indicator (3.40) and standard deviation of it (.960) indicate a high level of training opportunities for WLB as it is closer to 4. ABC allocates a huge budget for their employee training and development. Therefore, there is adequate training program relating to work life balance issues.
- According to mean value of supportive superior style (3.50)and standard deviation (.769) we can say that there is good superior subordinate relationship in Tire House.
- According to mean value of satisfaction with working hours indicator (2.9)and standard deviation (.699) we can conclude that there is low level of satisfaction regarding working hours. Because of Employee are required to work long hours whenever required for some seasons such as month ends (For HR department personnel to calculate OT levels), festival seasons (in calculating bonuses) in Tire House. This is the reason for low level of satisfaction regarding employee working hours.
- The overall level of work life balance of ABC staff is between high & average level indicating the mean value of the responses of 3.3354.
- The overall level of employee commitment of ABC staff is between high & average level indicating the mean value of the responses of 3.3533.
- The overall level of employee job satisfaction of ABC staff is between high & average level indicating the mean value of the responses of 3.4947.
There are many non-monetary benefits including medical schemes, employee Insurance schemes (covering family members also), death benefits etc.which leads to high level of job satisfaction and ultimately life time bound to the company.
All the job levels have high level of commitment and job satisfaction.
This study concludes that there is a significantly positive relationship between work life balance and employee outcomes (job satisfaction and commitment)in Tire House.
5.4. Recommendations
According to the data analysis there was a positive relationship between work life balance and employee outcomes. Firstly relationship between work life balance and employee commitment have strong positive relationship. As well as there is moderate positive relationship a between work life balance and employee job satisfaction. The overall relationship a between work life balance and employee outcome of the employees are at high level. Organization must take necessary action to establish a clear maintain employees work life balance. Based on these research findings we can made following recommendations for Tire House.
- Organization of training programs to fill the knowledge gap regarding how to resolve employee work life issues.
- Improve participative decision making procedure when make decisions regarding various purposes.
- Introduce a proper Performance Evaluation scheme and use it as a basis for promotion & rewards.
- Establish and develop employee reward management procedure which is rewarding performance of employees.
- Systematic job rotation which gives new challenges for employees in the work setting.
- Establish more opportunities for employee suggestions and ideas.
- Provide opportunities for employee career development.
- Introducing a promotion scheme based on performance, academic & professional qualifications and seniority.
- Improve employee training and development opportunities which sharp their education, talents, skills and other performances.
- Improving equity of pay level of employees.
- Provide sufficient welfare facilities such as social events, cafeteria and sanitary facilities, medical benefits, entertainment events and other associations.
- Establish well developed employee Health and safety management procedure.
- Developing friendly working environment where employees can improve their relationships.
- Applying Employee centered leadership policies which enhance positive relationship between superiors and workers.
- Enhancing employee job security in the work place.
5.5 Limitations
This research has few limitations and those to be noted to have the acknowledgement of the work. Firstly, this study is limited with the sample frame of only 60 employees. The afore-presented analysis and the recommendations are based exclusively on the responses of 60 employees who are the representatives of 365 members of ABC (Pvt) Ltd. The scheduled interview was 6, but unfortunately only 2 carried out due to inevitable circumstances. Sensibly speaking, the size of the sample frame could have been more, so it would have had a depth insight of results and recommendation. However, the findings are sufficient to feed the ABC (Pvt )Ltd management. Secondly, this study has limited generalisations and recommendations and thus it will not be applicable or suitable for other businesses in the same manufacturing and resale s industry. Thirdly, though this study comprises the both data collection techniques of questionnaire and interview, the interview responses were not specific and relatively vague if not could have gained more insights. Finally, the Non-English speakers were eliminated and the chosen sample of 60 was moderately good at both verbal and non-verbal. But the researcher could have translated the questionnaire in Sinhala as well-the widely spoken language in Sri Lanka. But unfortunately the questionnaire wasn’t translated to any language.
References
Abraham S (2012), Development of employee engagement programme on the basis of employee satisfaction survey, Vol.4, No.1, pp.27-37
Aktouf O (1992), Management and theories of organisations in the 1990s. Academy of Management Review, Vol.17, pp.407-431
Armstrong M (2009), Armstrong’s handbook of human resource management practice, edi.11
Ayers E (2009), Why engagement is not enough, Vol.36, No.2, pp.10-11
Bakker B & Leiter P (2010), Work engagement: a handbook of essential theory and research, NY
Barry H (2008), The impact of office comfort on productivity, Journal of Facilities Management, Vol.6, No.1, pp.37-51
BlessingWhite (2015), Employee engagement research updated
Bowen, D.E. and Ostroff, C. (2004). Understanding HRM-firm performance linkages: the role of the strength of the HRM systems, Academy of Management Review, Vol. 29,, pp. 203-21.
Brown P (1996), A meta-snalysis and review of organisational research on job involvement. Psychological Bulletin, Vol.120, pp.234-55
Bryman A & Bell E (2007), Business Research Methods, edi.2, Oxford, McGraw-Hill
Cartwright S & Holmes N (2006), The meaning of work: the challenge of regaining employee engagement and reducing cynicism. Human Resource Management Review, Vol.16, pp.199-208
Champathes R (2006), Coaching for performance improvement: The coach model. Development and learning in organisations, Vol.20, No.2, pp.17-18
CIPD (2006), Annual Survey Report
Cooper R & Schindler S (2003), Business Research Methods, edi.8, NY, McGraw-Hill
Coldwell D & Herbst F (2004), Business Research. South Africa
Corporate Leadership Council (2007), Washington
Credit Union Magazine (2006), Friends At Work? Priceless, Vol.72, No.12, pp.14
Cummings J (2004), Work groups, structural diversity, and knowledge sharing in a global organisation, Management Science, Vol.50, No.3, pp.352-64
Denscombe M (2010), The good research guide: for small-scale social research projects, edi.4, McGraw-Hill
Appendix A- Questionnaire
Segment A
| # | GENERAL PERSPECTIVE | Disagree | Neutral | Agree |
| 01 | I receive recognition for doing my job well | |||
| 02 | My supervisor concerned about my welfare | |||
| 03 | I have friends at work | |||
| 04 | I will still be employed here for some years | |||
| 05 | I receive feedback about my performance at work | |||
| 06 | The workplace climate is emotionally positive, comfortable and relaxed | |||
| 07 | I trust my senior leaders and superiors | |||
| 08 | I get high level of support from supervisors | |||
| 09 | The management shares enough job-related information with the personnel | |||
| 10 | I find time to spend with my family after finishing work |
Segment B
| # | SIGNIFICANCE OF EMPLOYEE ENGAGEMENT | Disagree | Neutral | Agree |
| 11 | If employees are engaged it will positively impact on productivity | |||
| 12 | If employees are engaged it will enhance organisational performance | |||
| 13 | If employees are engaged it clear the hurdles of the victory and lead to company success |
Segment C
| # | GEARS OF EMPLOYEE ENGAGEMENT | Disagree | Neutral | Agree |
| 14 | Training & development available to everyone | |||
| 15 | I know what is exactly expected from me | |||
| 16 | I do receive necessary training to perform my tasks | |||
| 17 | Company encourages sharing information, resources and knowledge | |||
| 18 | Company provides career opportunities for employees to develop and grow | |||
| 19 | In the last year I had opportunities to learn and grow | |||
| 20 | The company values work and home life balance | |||
| 21 | My opinion seems to be count | |||
| 22 | Company has a culture of employee engagement | |||
| 23 | Company celebrates the victory with its employees |
Segment D
| # | FACTS OF MOTIVATION | Disagree | Neutral | Agree |
| 24 | My salary equivalent to my performance | |||
| 25 | Resources are readily available to perform my task | |||
| 26 | My job is rewarding and I’m satisfying | |||
| 27 | I enjoy coming to work and willing to do extra shifts | |||
| 28 | In my department we work as a team | |||
| 29 | I frequently receive recognition and praise |
Segment E
| # | FACTS OF LEADERSHIP/MANAGEMENT | Disagree | Neutral | Agree |
| 30 | Managers communicate frequently | |||
| 31 | Managers keep me informed with latest updates | |||
| 32 | Mangers empower employees to made decisions | |||
| 33 | My superiors provide sufficient freedom | |||
| 34 | Employees and management experience high level of trust |
Segment F
- Sex
- Male [ ] ii. Female [ ]
- Age
- 20-25 [ ] ii. 26-30 [ ] iii. 31-35 [ ] iv. 36-40[ ]
- 41-45 [ ] vi. Above 45 [ ]
- Marital status
- Single [ ] ii. Married [ ] iii. Widowed [ ]
- Education level
- A/L [ ] ii. Professional Qualification [ ]
iii. Diploma [ ] iv. Degree [ ]
v. Masters Degree [ ] vi. Other [ ]
- Job role
- Executive [ ] ii. Senior Executive [ ] iii. Asst. Manager [ ]
iv. Manager [ ] v. Senior Manager [ ]
- Net income level
- Less than 25 [ ] ii. 25-35 [ ] iii. 35-45 [ ] iv. 45-55 [ ]
v. Above 55 [ ]
- Number of organisations worked prior to present
- 0 [ ] ii. 1 [ ] iii. 2 [ ] iv. 3 [ ] v. 4 [ ]
- Years of experience with present organisation
- 0-5 [ ] ii. 5-10 [ ] iii. 10-15 [ ] iv. 15-20 [ ] v. More than 20 [ ]
- Department in the organization
- HR [ ] ii. Production [ ] iii. Marketing [ ] iv.Finance [ ] v. Internal Audit [ ] vi. Other [ ]
- Do you supervise anyone
- Yes [ ] ii. No [ ]
- Would you like to provide additional information for your aforementioned responses?

Leave a Reply