
- Introduction
In women’s life cycle, pregnancy is one of the most important and unique period. Pregnancy is the nine months which a woman carries a developing embryo and fetus in her womb (WHO, 2017). Proper nutrition is a very important consideration during this period to have a healthy pregnancy because nutrient requirements are increased than other stages of the life cycle. Due to that reason pregnancy is a vulnerable group for nutritional problems. In the determination of pregnancy outcomes, maternal nutritional status is a major determinant. Nutritional status during pregnancy is determined by the nutrient intakes and dietary patterns, including macro and micro nutrients. Poor nutritional status during pregnancy is associated with inadequate weight gain, anemia, retarded fetal growth low birth weight, still births, preterm delivery, intrauterine growth retardation, morbidity and mortality (Kansal et al., cited in Chowdhury et al., 2015).
For the growth of the fetus, mothers’ nutritional status plays a major role. Nutrients are provided through the placenta from mother to fetus. Women with a good nutrition prior to conception as well as during pregnancy may have a pregnancy without complications and a healthy baby (Papadopol et al., 2001). Maternal malnutrition may increase the morbidity and mortality among women and it may have an effect on the birth weight of baby. Low birth weight (<2.5 kg) can result from due to the decrements in fetal growth or length and it may increase the risk of infant morbidity and mortality. Inadequate maternal micronutrient intake is a reason to have low birth weight babies (Gernand et al., 2016).
Inadequate dietary intake may result deficiencies of essential nutrients in women of reproductive age specially during pregnancy and lactation (Bhandari et al., 2016) because they are more vulnerable to malnutrition. Improper preparation of foods, taboos, infectious diseases, lack of education, lack of care and food security is some of the reasons for that issue. Women who consume limited animal source foods, fruits and vegetables, increase their risk of micronutrient deficiencies. Women who consume low protein and carbohydrate diets are in the risk of malnutrition and at increased risk of child mortality.
Nutritional status is an indication of the overall well-being of the society. Adequate nutritional status of women is important for good health and increased work capacity as well as for the health of their offspring. Poor nutrition is an indicator of health risks to both mother and children born to them (Bhandari et al., 2016). Nutritional status can be determined by anthropometry, biochemical tests and dietary intake. Anthropometry represents the cumulative effect of access to food, health, education and environmental health conditions (Malkanthi et al., 2007). Biochemical tests represent the strength of body’s biochemical parameters. Dietary intake is a good indicator to determine the nutrient intake through the diet. Therefore, nutritional status is a powerful indicator of nutrition security and individual’s well-being.
Nutritional status assessment is mainly done to check malnutrition. Malnutrition of pregnant mothers impedes social and economic well-being. So, it has become an important topic to be addressed. Malnutrition among pregnant mothers’ results reduced productivity, increase susceptibility to infections, slow recovery from illnesses and etc. The women with a poor nutritional status can be indicated by low BMI, short stature, micronutrient deficiencies and they are in the greater risk of having LBW babies, delivery complications, post-partum hemorrhage and etc. Therefore nutritional status of pregnant mothers is a critical issue that impedes to the health and development of the society while causing an irreversible damage for future development by increasing the risk of girls becoming malnourished mothers, who then have a low-birth-weight baby.
Sri-Lanka is a developing country. It has more nutritional problems. There is a prevalence of LBW;11.2% (FHB, 2017), neonatal mortality rate; 6 deaths per 1000 live births (FHB, 2017), maternal mortality rate; 33.7 per 100,000 live births (FHB, 2017) and anemia prevalence among pregnant mothers is 34% (DHS 2006/7).
According to above figures, it is a need to improve the maternal health and nutritional status. There are studies have been conducted to determine the nutritional status, dietary intake and micronutrient deficiencies of pregnant women. But there are limited studies that show how the dietary intake affects to the nutritional status of pregnant mothers. This study seeks to assess the dietary intake and nutritional status of pregnant women. Further this study unfolds a new area that reveals how the dietary intake effects on the nutritional status of pregnant women.
Objective
To assess the effects of dietary intake on nutritional status of pregnant women
02. Literature Review
2.1 What is pregnancy?
Pregnancy is, one of the most important and unique period. It is a period that is having a great stress due to numerous anabolic activities that take place in relation to fatal growth, maternal body composition and metabolism.
2.2 Nutritional needs during pregnancy
Nutrition is the intake of food, considered in relation to the body’s dietary needs (WHO, 2007). Complete, balanced diet that meets all the recommended nutritional needs before and during pregnancy increases the positive outcomes. It provides numerous health benefits for mother and baby. Nutritional status during pregnancy is determined by the nutrient intake during pregnancy, including the macro and micro nutrients.
Nutrients are chemical components found in food. There are five major classes of nutrients as carbohydrate, protein, fat, minerals and vitamins. These nutrient classes can be categorized as either macronutrients or micronutrients. Macronutrients are needed in relatively large amounts and micronutrients are needed in smaller amounts. The macronutrients are carbohydrates, protein and fats. The micronutrients are minerals and vitamins.
As the pregnancy is a physiological condition, it results in hormonal, hemodynamic and hematological changes (Raza et al., 2011). So, these changes need to have some adaptations as a response to the change. As example, increasing the total blood volume helps to circulate extra amount of oxygen and other essential nutrients effectively in the body. Also it helps to combat the hazards of hemorrhage delivery, increases the iron reserves and lowers the risk of iron deficiency.
The most vulnerable periods are the embryo at conception, and in the subsequent weeks afterwards, because this is the period when the organs and systems develop rapidly. The energy needed to create these systems comes from the energy and nutrients in the mother’s blood circulation. So, having enough and correct nutrient intake during pregnancy is very important. A daily diet containing only 1000kcal has been shown to greatly retard fetal growth and development. Placenta is not formed in the early stages of pregnancy and there is no mechanism to protect the embryo from the deficiencies and it is important to take correct amount of nutrients and energy (Latham, 1997).
2.3 Role of nutrition during pregnancy
Macro and micro nutrient needs increase during pregnancy to meet high demands of both mother and the fetus. Nutrition throughout life has a major effect on health. This is true for pregnant women as adequate maternal nutrition is one of the best ways to ensure maternal and fetal wellbeing. Mother’s nutritional status at conception, during pregnancy and lactation, plays a key role in determining her and child’s health (Daba et al., 2013).
Maternal nutrition during pregnancy has gained interest over the years because of the understanding that there is an increased physiologic, metabolic and nutritional demand associated with pregnancy. This has been regarded as an important determinant for fetal growth (Godfrey and Barker 2000, cited in Ugwa, 2016).
First trimester
This is the period of first three months of the pregnancy. Occurring of nutritional deficiencies at this stage may alter the development of the fetus and the effects may last in their lifetime. In the first trimester, the development of fetus is rapid. If an essential nutrient is not adequately available, the fetus may be affected. So, the quality of the diet is more important than the quantity. Hence pregnant women should consume nutrient dense food. Though some women lose their appetite and feel nausea during the first trimester, they should be careful to obtain adequate nutrition.
The second trimester
Second trimester includes the period beginning from forth month to sixth month of pregnancy. During this period there is a big tendency to have nutritional deficiencies more on the fetus than mother. For instance if she does not meet her nutritional requirements at this time, her ability to successfully breastfeed her infant may be affected, as fat stored during pregnancy serves as energy reserve for lactation.
The third trimester
This is the period of last three months of pregnancy (7-9 months). This stage is also a very critical stage. There, infant drag nutrient from mother’s stores and fulfill the requirements.
2.4 Essential nutrients during pregnancy
2.4.1 Energy
There is a common saying in the society as a pregnant woman is “eating for two”. Actually this is technically correct because they have to get some additional calories as well
In the weight gain of pregnancy, energy is the chief nutritional determinant. However, the strength of the relation is confounded by a number of intervening factors. Some examples are changes in basal metabolism and levels of physical activity, the composition of accumulated maternal and fetal tissue. The most important thing is that during pregnancy, additional energy is required for the growth and maintenance of the fetus, the placenta, and maternal tissues. Energy metabolism changes during the period of pregnancy and differs considerably (Abu-Saad et al., 2010).
As recommended by WHO, during pregnancy women increase their energy intake by 85 kcal/day in the first trimester, 285 kcal/day in the second trimester, and 475 kcal/day in the third trimester.
A large retrospective cohort study in rural Gambia showed rates of small-for-gestational-age births are highest at the end of the “hungry” season and it is negatively associated with maternal weight gain.
2.4.2 Macronutrients
Carbohydrates
Dietary carbohydrate is broken down to glucose and they are used as the main energy source to the fetus. Low carbohydrate diet is dangerous during pregnancy because, it may cause a poor growth of the baby. The amount should prevent ketosis which harm to the fetus. But a mild restriction is recommended if the mother is diabetic.
Protein
RDA for proteins is 52 grams per day (MRI, 2007). Healthy fetal development is dependent on the availability of adequate protein provided during pregnancy. During this period, the mother should eat adequate protein amount to meet the needs of growing fetus in addition to meeting her own increased needs to the physical growth. Protein is needed for the weight gain during pregnancy. Nearly 40% of the total weight gain by the mother is represented by the fetus, placenta, and amniotic fluid. The remaining 60% represents maternal tissues, including uterine tissue, breast tissue, blood, adipose tissue, and extracellular fluids. (Kalhan, 2017) However, these estimates did not include changes in other organs, such as the liver, kidney, and heart, which are also known to increase in size during pregnancy.
Fats and lipids
Fat requirements do not change during pregnancy. The American Heart Association guidelines for fat are 30% of total calories per day. The fat intake of a 2000-calorie diet is 60 g/day. Saturated fats should be limited and the majority of fat should be monounsaturated and polyunsaturated (Arulkumaran, 2010). Lipids are essential for the formation of cell membranes and hormones and are necessary for proper eye and brain development.
Human can synthesize saturated and monounsaturated fatty acids except n-3 and the n-6 polyunsaturated fatty acids. They are essential fatty acids. So, they must be obtained through the diet. They are important structural elements of cell membranes and so, these fatty acids are essential to the formation of new tissues, which occurs at an elevated rate during pregnancy and fetal development (Abu-Saad et al., 2010).
As Abu-Saad et al stated in 2010, there is some evidence from biochemical studies among populations with high marine-food intakes suggesting that higher intakes of long-chain omega-3 fatty acids during pregnancy may result in an increased duration of gestation and may also improve fetal growth
2.4.3 Micronutrients
Vitamins and minerals support every stage of maternal, placental and fetal interaction to enable a healthy gestation (Gernand et al., 2016). Micronutrients are receiving most attention in pregnancy.
2.4.3.1 Minerals
Generally the needs for minerals increase during pregnancy, especially that for iron, calcium, iodine and zinc.
Iron
The iron requirement in pregnancy is 33 mg per day. The important thing is that the demand is difficult to meet from dietary sources alone, because diets are limited in iron content and bioavailability is generally low or moderate due to high intakes of dietary fiber and phytates (Raza et al., 2011).
Women often need an iron supplement, especially if they do not consume iron fortified foods. For better absorption of iron, iron supplements should not be taken with milk, coffee or tea and vitamin C rich foods should be taken along with iron rich foods (Latham, 1997).
Iron deficiency is one of the most common nutritional deficiencies worldwide. Iron deficiency can be defined as the condition of body iron stores become depleted and a restricted supply of iron to various tissues becomes apparent. (Raza et al., 2011) As defined by the World Health Organization Anemia occurs when haemoglobin levels lower than <11 g/dL. Severe iron deficiency anaemia in pregnancy may lead to preterm delivery, low birth weight, and increased risk for fetal death in the first weeks after birth. An inadequate iron intake may actually be more harmful to the mother than the infant.
Calcium
This is needed during pregnancy to promote adequate mineralization of the fetal skeleton and teeth. Most calcium is required during the third trimester, when skeletal bones are growing most rapidly and teeth are forming. However, extra calcium intake should start immediately after conception. 750mg of calcium is required in pregnancy
Zinc
Zinc is a mineral important for supporting growth and development. The RDA increases 25% for pregnant women. The protein foods in the diet provide this amount of zinc. Poor zinc status in pregnancy increases the risk for having a low birth weight infant.
2.4.3.2 Vitamins
Generally vitamins demand increase, specially the need for vitamin A, Vitamin D, Vitamin C, Vitamin K and folate during pregnancy.
Vitamin A
Vitamin A is also an important fat soluble vitamin needed during pregnancy. Vitamin A deficiency during pregnancy weakens the immune system, increases the risk of infections and it causes the night blindness (Dreyfuss et al., 2000).
Vitamin D
Calcium metabolism increases during pregnancy to absorb and distribute extra calcium for developing fetus bones. Also Vitamin D is needed to aid the calcium absorption in mother’s body. Adequate amounts of vitamin D can usually be achieved with approximately 20 to 30 minutes of exposure of sun several times a week to the face, arms and hands.
Maternal vitamin D deficiency during pregnancy has been linked to maternal osteomalacia as well as to reduced birth weight and neonatal hypocalcaemia. Low sun exposure, dark skin are risk factors for vitamin D deficiency. Most studies indicate that the placental transfer of vitamin D to the infant is particularly important because of low vitamin D concentrations in breast milk.
Vitamin C
Both mother and fetus need vitamin C to make collagen, a structural protein that’s a component of cartilage, tendons, bones and skin. Vitamin C deficiency can impair mental development. A significant benefit of vitamin C is it influences on non-heme iron absorption. By adding non-heme iron absorption from plant sources, vitamin C also plays a role in
Vitamin K
Vitamin K intake during pregnancy is very essential because it can prevent hemorrhagic disease of the new born, which can be fatal. Researchers have shown that before birth giving vitamin K to mothers for a period of time can prevent this problem. Additional result indicates that this strategy improves measures of vitamin K status and coagulation function.
Folate
Folate is a critical nutrient during pregnancy. Because of the synthesis of DNA requires folate. So, both maternal and fetal growth in pregnancy depends on an ample supply of folate. Insufficient maternal folate intake has been linked to low birth weight, IUGR and preterm birth. The deficiency of folate at conception has also been associated with neural tube defects such as spina bifida. The RDA for folate increases during pregnancy up to 600 µg per day. The women who got inadequate intake of folate should have supplementation to meet the recommended levels.
Table 2.1: RDA for pregnancy
| Nutrient (units) | RDA * |
| Energy(kcal) | 2360** |
| Carbohydrates(g) | 175** |
| Protein(g) | 52 |
| Iron(mg) | 33 |
| Calcium(mg) | 750 |
| Iodine (µg) | 250 |
| Folic acid (µg) | 600 |
| Vitamin C(mg) | 58 |
| Vitamin A(µg) | 800 |
(* Source: Recommended Dietary Allowances for Sri-Lankans, Department of Nutrition, Medical Research Institute, Colombo, 2007)
(** Source: Food and Nutrition Board, Institute of Medicine, National Academics, 2011)
2.5 Assessing nutritional status of pregnant women in different methods
2.5.1 Anthropometry Measurement
Maternal anthropometric aspects and intake of adequate nutrients are the determinants of fetal growth. It has a close association with, weight and gestational age at birth. An anthropometric measurement is the most frequently applied methods for assessing nutritional status in pregnant women (Carvalho et al., 2009). It has recognized as effective tools in the prevention of perinatal morbidity and mortality, the prognosis of child health, and the promotion of women’s health and have undergone considerable improvement over the past five decades (Carvalho et al., 2009). In addition, their easy application, low cost, and non-invasive nature reinforce their viability as a nutritional assessment method.
Maternal height
Height is a cumulative result of the interaction between environmental and genetic conditions. Short maternal height is associated with low offspring birth size, childhood stunting because shorter women may have reduced protein and energy stores, smaller reproductive organ sizes, and limited room for fetal development (Addo et al., 2013)
MUAC
In the determination of maternal nutritional status, weight may not be the best indicator to estimate maternal muscle and fat stores (Thomas et al., 2012). MUAC is a simple and inexpensive method that is used to measure fat-free mass. MUAC is the measurement of the circumference of the upper arm at the midpoint. This measurement can be useful as an indicator of protein-energy malnutrition or starvation, specially in the situations where measuring height and height may not be feasible (Tang et al., 2016)
Pre-pregnancy BMI
Pre-pregnancy BMI is one of the golden indicator that is used to determine the nutritional status. It is used to measure the body fat based on weight and height (Institute of Medicine, 2009). A low BMI is a recognized risk factor for the delivery of SGA infants. Being SGA is a major predictor of neonatal mortality and morbidity, growth failure, slow cognitive development and chronic diseases in adulthood (Ota et al., 2011). High BMI is also a risk factor during pregnancy. For offspring, maternal high BMI may cause childhood obesity (Thangaratinam et al., 2012).
2.5.2 Biochemical tests
Hemoglobin level
Hemoglobin is needed to extract oxygen. Maternal oxygenated hemoglobin deliver oxygen to fetal hemoglobin across the placenta. Lowering hemoglobin levels than 11g/dL represents anemia condition. Anemia is a condition in which the number of red blood cells or their oxygen-carrying capacity is insufficient to meet physiologic needs (WHO, 2017)
Classification of Anemia
According to World health organization, anemia is classified in to three broad headings. They are,
- Moderate/ mild anemia (Hb 7.0- 10.9)
- Severe anemia (Hb 4.0-6.9g/dl)
- Very severe anemia (Hb below 4.0g/dl)
Iron deficiency is the commonest nutritional deficiency among pregnant women worldwide. It can manifest in a wide spectrum, with iron deficiency anemia being the most severe form (Palihawadana et al., 2014). Sri-Lanka 34% pregnant women are anemic including 20.7% of mild anemia and 13.3% of moderate to severe anemia (DHS, 2006/07). Deficiency of iron in pregnant women limits oxygen delivery to cell resulting in fatigue, poor work performance and decreased immunity. Iron deficiency anemia early in a pregnancy can double or even triple the risk of having a premature delivery or a low birth weight baby ( Raza et al. 2011)
Serum total protein and serum albumin level
Proteins are important building blocks of the body and are vital for body health. Albumin is the major type of plasma proteins found in the blood. In a study done by Lee et al., 2006, showed that serum albumin and Hb level were significantly contributing to low birth weight. A low level of total protein may indicate a serious case of malnutrition due to a lack of insufficient absorption of proteins. Also it may be a kidney or liver related disease. (DoveMed, 2016)
2.5.3 Dietary method
Assessment of dietary nutrient intake is used to monitor nutritional status, ongoing nutritional transition and for development of appropriate interventions among different populations (Jayawardena, 2016). Different methods have been used to measure dietary intake such as 24 hour dietary recalls, diet diaries, food frequency questionnaires and etc. Sri-Lanka is a low-middle income country and it is undergoing nutritional transition. Pregnant women are a part of it and they are more vulnerable to them. So, the assessment of dietary nutrient intake of pregnant women is a good indicator to predict their nutritional status.
2.6 Factors affecting to nutritional status of mother
Adequate maternal nutrition is one of the best ways to ensure maternal and fetal wellbeing. A mother’s nutritional status at conception, during pregnancy and lactation, plays a key role in the determination of the health and well-being of mother and child.(Daba et al, 2013)
2.6.1 Health status of mother
In developing countries, more than 40% of pregnancies result in complications, illness, or permanent disability for the mother or child (Tinker et al., 1994, cited in Daba et at, 2013). More than 7 million newborn deaths are associated with maternal health- and nutrition related problems resulting from poorly managed pregnancies and deliveries or inadequate care of the neonate soon after birth (WHO, 1997, cited in Daba et al, 2013).
A full-term, healthy live birth-is a powerful, strong indicator of the health status of women. However, poor or inadequate diet during pregnancy is a determinant of maternal health. There is a two-way relationship between women’s health and pregnancy outcome. One is poor maternal health results in high rates of fetal and early infant deaths. Another one is iron deficiency anemia during pregnancy
2.6.2 Socio economic factors
Socio economic factors have been shown to be essential predictors of nutrient intake and diet quality (Kamau- Mbuthia and Elmadfa, 2007). Generally, there are nutrient deficiencies in low-socio economic populations, where they are more likely to involve multiple rather than single deficiencies (Fall et al., 2003). Currently the world has a crisis of high food prices, which affects access to the nutrition value of food. Food choices are determined by price and dietary diversity. They are the main reasons to be dropped from the diet due to high cost.
2.6.3 Cultural Practices
Nutritional status during pregnancy is determined by the culture as well. Culture is defined as the way a group of people live and do things together. Every culture is having norms and values. Some communities consider certain foods as taboos and though such foods may be nutritionally good, they will not be considered as food.
2.6.4 Birth spacing
Women can’t replenish their nutritional stores after delivery, when they have short birth spacing. Pregnancies among such women tend to be very vulnerable and have a higher risk of anemia. As a result of closely spaced pregnancies they may get low availability and poor absorption of iron and lead to depleted iron stores of pregnant women.
2.6.5 Care given to pregnant mother
Nutritional care given to pregnant mothers is an essential element. Nutritional care and support includes many components, such as nutrition education and counseling in health facilities, water and hygiene and food safety interventions to prevent diarrhea and adequate quality/quantity of food and food aid. (WHO/2017) Pregnant women need more care and support specially for first time mothers. Most of the time due to the physiological change in their bodies, they tend to have special cravings for certain non- food substances such as pica. Morning sickness in pregnancy causes some women to avoid food. They need support from family and friends to ensure that to not to become malnourished.
2.6.6 Food preparation
The way food preparation is also usually effects on the nutritional status of pregnant women. For example, when preparing green leafy vegetables, if it is cooked for a long time, the nutrients (iron) may be lost. Sometimes, when vegetables are washed, cut into pieces, soaked, overcooked and then reheated. In some cases, cooking water from rice is discarded. Such practices can reduce the quantity of water- soluble, heat – liable vitamins like ascorbic acid, folic acid, and thiamine. Unhygienic food preparation such as the use of polluted water in food preparation can affect the quality of the food.
2.6.7 Lifestyle
Food cravings are a common thing during pregnancy. Some women feel strong urges to eat non-food items such as clay, ice, laundry starch, corn starch and etc. This is called “pica”. It can be harmful to pregnancy. It can affect the intake of nutrients and can lead to constipation and anemia. Another important thing is smoking. It is linked with preterm birth and low birth weight and appears to increase the risk of birth defects, sudden infant death syndrome, and childhood cancer. Fetal alcohol syndrome occurs due to the alcohol intake during pregnancy. Alcohol passes through the placenta and affects the developing fetus and interferes with normal prenatal development. At birth, infants with fetal alcohol syndrome are smaller than normal, both in weight and length (Kinney, 2000).
2.6.8 Biological factors
Biological factors are heredity factors that involves with the nutritional status of pregnant mothers. For example in families of overweight, people may have overweight babies. Maternal obesity is a global health problem and it may raise the risk of several congenital anomalies. Also the infants of obese mothers are at increased risk of birth difficulties, macrosomia, and perinatal death (Arulkumaran, 2009). An underweight mother has more ability to give birth to underweight babies due to their short stature. Women with short stature are at high risk of low birth weight, preterm delivery and obstetric complications during delivery.
As well, most of pregnant women experience nausea during the early stages of pregnancy. It may be related to the increased sense of smell induced by the pregnancy related hormones circulating in the bloodstream. When the condition get severe, it can be identified as Hyperemesis gravidarum as a severe form of morning sickness and excessive pregnancy related nausea and vomiting that prevent adequate intake of food and fluid (Begum et al., 2010)
2.7 Consequences of nutritional deficiencies
Women living in low-income countries are often unable to meet the micronutrient demands of pregnancy because of chronically poor diet (Torheim et al., 2010). So, there may be an inadequate supply of nutrients. It will cause a state of biological competition between the mother and the fetus and so, both organisms are at serious risk (King, 2003).
Iron deficiency has been associated with maternal mortality. It affects with the immune status as well. A low plasma iron concentration also selectively inhibits proliferation of immune cells and so, iron may be important for maintaining maternal health and reducing the risk of infection. (Ladipo, 2000)
Though Calcium is an essential nutrient, calcium deficiency is rare in pregnancy but it appears in cases of hyperparathyroidism (Ladipo, 2000). The thing is, low calcium and magnesium concentrations have been associated with hypertensive disorders of pregnancy.
When consider about consequences of Vitamin A deficiency, it is rare in industrialized countries, but quite common in other parts of the world. Vitamin A deficiency may cause impaired lung development and may have premature babies with respiratory distress syndrome. The vitamin A content of breast milk is associated with the vitamin A status of the mother during the third trimester of pregnancy (Arulkumaran, 2009)
Inadequate intake of folic acid is associated with an increased risk of neural tube defects
Zinc deficiency has been associated with congenital abnormalities, abortions, intrauterine growth retardation, premature birth, and preeclampsia. Zinc deficiency can also affect the immune response also.
2.8 Nutritional interventions for pregnancy
Nutrition Intervention is defined as purposefully planned actions intended to positively change a nutrition- related behavior, environmental condition, or aspect of health status for an individual, target group, or the community at large (Gunawardhana, 2011). There are nutrition intervention programs for pregnant mothers to improve their nutritional status. They can be mentioned as, nutritional assessment, monitoring pregnancy weight gain, micronutrient supplementation, de-worm treatment after first trimester, Thiposha /corn soya blend(CSB) supplements.
2.8.1 Micronutrient supplementation
Micronutrient supplementation is more suitable for pregnant women who do not consume an adequate diet. (Arulkumaran, 2009) In Sri-Lanka, micronutrient supplementation for pregnant mother begins after 12 weeks.
Table1 2.2: Sri-Lankan recommendations for micronutrient supplementation for pregnant and lactating mothers
| Supplement | Supplement composition and Dosage | Frequency | Schedule and duration |
| Iron | 60 mg of elemental iron 1 tablet (ferrous sulphate) | One supplement daily | During second and third trimesters and continue for 6 months during lactation |
| Folic acid | Folic acid 1 mg tablet | One supplement daily | Throughout pregnancy continue for 6 months during lactation |
| Calcium | 600 mg of calcium tablet | One supplement daily | During second and third trimesters |
| 300 mg of calcium tablet | One supplement daily | For 6 months after delivery | |
| Vitamin A mega dose | 200,000 IU | One supplement daily | Soon after delivery or within 4 weeks after delivery |
Source: (FHB, 2014)
2.8.2 Thriposha Intervention Programe
Thriposha program was initiated in 1973 by the Ministry of Health care and Nutrition. The main aim was to combat the high incidence of child malnutrition (protein-energy malnutrition), low birth weight, and micronutrient deficiencies of iron and vitamin A in key biological groups in Sri Lanka. Thriposha is distributed among pregnant women, breastfeeding mothers and underweight children.
Table 2.3: Ingredients of Thriposha
| Ingredients | % |
| Maize | 66 |
| Soya | 30 |
| Full cream milk powder | 3 |
| Vitamin premix | 0.1 |
| Mineral premix | 0.9 |
Thriposha is a pre-cooked ready to eat supplementary food. 50g of thriposha provides 150 kCal. Pregnant mothers are recommended to get three thriposha tablespoons with one tablespoon of sugar and two table spoons of scraped coconut.
Other than supplementation food fortification is also an effective intervention programe. The fortified food products are expected to become the main source of the specific added nutrient in the targeted population that helps to prevent inadequacies of certain nutrients in groups at risk. The effectiveness of such a programs depends on whether or not the fortified food is accepted, purchased, and consumed by them.
( Hettiarachchi, 2013)
2.8.3 Poshana malla
Poshana malla (provision of a food basket) was supplied through the samurdhi programe implemented by the Ministry of Samurdhi and Poverty Alleviation. Under this program, a “poshana malla”, basket of foods containing selected dry commodities to the value of Rs.500/- was issued monthly. It includes 5kg of rice, 8 eggs, 500g of cowpea/green gram/sprats, 5 coconuts/ one bottle of coconut oil per month. It is given to all samurdhi beneficiary pregnant and lactating mothers for a period of 18 months (six months before delivery and 12 months after delivery) in selected areas (MRI, 2010)
03. Methadology
3.1 Study area
The study was carried out in Pannala and Kuliyapitiya (West) MOH areas located in Kurunegala District, North Western Province. Total population of Pannala was 127,715 and Kuliyapitiya (West) was 83,715 in 2016. There were 33 PHM areas in Pannala MOH area and 22 PHM areas in Kuliyapitiya (West) MOH area.
3.1.1 Geographical location of Pannala MOH area


Figure 3.2: Map of Pannala MOH area showing the PHM areas
Figure3.1: Map of Sri-Lanka which
shows the geographic location of
North Western province
3.3.2 Geographical location of Kuliyapitiya (West) MOH area

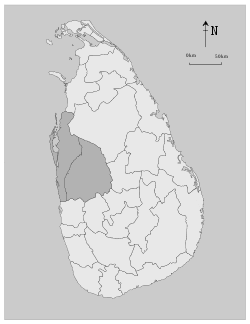
Figure 3.3: Map of Sri-Lanka which
Figure 3.4 Map of Kuliyapitiya (West) MOH area showing
the PHM areas
shows the geographic location of
North Western province
3.2 Study design
This was conducted as a cross-sectional study
3.3 Study population
Pregnant mothers who completed their first trimester and regularly attending to MCH clinics in Pannala and Kuliyapitiya (west) in the data collection period.
3.4 Study sample
3.4.1 Sample size
When dividing the population in to groups, sampling is the best method. It divides the members of the population into homogeneous subgroups before data collection. When the density of the population varies with the region, ethnicity, culture, sampling will ensure that estimates are having an equal distribution within the area.
Sample size is calculated using the equation below, using the 95% confidence interval and 10% error.
n= sample size
z= confidence interval
p= prevalence
q= 1-p
= 152.8
Prevalence of low birth weight in Sri-Lanka = 11.2% (FHB/2016)
150 of data were collected. Considering the population in 2016 in Kuliyapitiya (west) and Pannala areas, sample size was proportionately divided.
Table 3.1: Distribution of the sample according to the population of selected two areas in 2016
| MOH area | Total population in 2016 | Sample size |
| Kuliyapitiya west | 83 715 | 60 |
| Pannala | 127 715 | 90 |
MCH clinics were selected according to the convenient sampling method. The selected clinics from Pannala were Pannala, Elabadagama, Elibichchiya, Bammanna, Horawadunna, Bopitiya and selected clinics from Kuliyapitiya(West) were Hammalawa, Deegalla, Annarugama, Kumbukkotuwa and Bohingamuwa.
3.4.2 Inclusion criteria
- Pregnant mothers who are regularly attending to Pannala and Kuliyapitiya (West) MCH clinics
- Pregnant mothers who completed their the first trimester
- Pregnant mothers who are not having non-communicable diseases
- Pregnant mothers who are taking micronutrient supplements only from the clinic
3.4.3 Exclusion criteria
- Pregnant mothers who are suffering from non-communicable diseases. (Diabetics, Blood cholesterol, high blood pressure)
3.5 Ethical Consideration
Ethical clearance was obtained from ethical review committee (Ethical review committee, Faculty of Medicine, Peradeniya)
Then the permission was obtained from Chief Medical Officers in Pannala and Kuliyapitiya (West) MOH offices to conduct this survey. Then the information sheet of the study that contained all the details was given to the subjects and the purpose of this study was explained to pregnant mothers. The consent of the subjects was taken literally before the data collection. (Information sheet and consent form is shown in annex I)
3.6 Data collection
In the data collection different tools were used. Pre-tested interviewer administered socio demographic, life style and health questionnaire, anthropometric measurements, pregnancy records, three day diet diary and two biochemical tests (Biuret test to determine serum total protein content and bromo cresol green test to determine serum albumin content) were used.
3.6.1 Interviewer administered Socio-demographic, life style and health questionnaire
Interviewer administered socio demographic, life style and health questionnaire was used to collect subjects’ information related to following topics.
3.6.1.1general information
Age, ethnicity, employment, monthly family income, home gardening
3.6.1.2Obstetric information
Pre-pregnancy weight, height, pregnancy week, maternal health problems, taking supplements
3.6.1.3 Dietary practices and food habits
Vegetarianism, food allergies, food avoidance, food cravings, consumption of cereals and consumption of tea
3.6.1.4 Information of food preparation
Preparation of green leafy vegetables, type of cooking oil used, using of iodized salt
(Socio-demographic, life style and health questionnaire is shown in annex II)
Socio-demographic, life style and health questionnaire was pre-tested before the data collection using ten subjects and it was improved according to the responses given by them. The data collection from the questionnaire was interviewer administered. The interviewer asked the questions in the questionnaire from the subjects and filled it according to their responses.
3.6.2 Anthropometric information
3.6.2.1 Weight
Maternal weight was measured to the nearest 0.1kg using a calibrated electronic digital adult weighing scale (seca.813). The adult weighing scale was placed on a hard flat surface and checked for zero before each measurement. The subject was asked to remove unnecessary items that are in their pockets (ex: mobile phones, bags, purse and etc.) The subject was asked to stand in the center of the platform and asked to look straight ahead, standing relaxed. Measurements were taken.
3.6.2.2Height
Maternal height was measured to the nearest 0.1cm using a stadiometer (seca.213). The subject was asked to remove any hair ornament, jewelry from the head and stand straight against with heels, buttocks, scapulae and back of the head touching the wall of the backboard of the stediometer. Then the subject was instructed to hold the feet together and apart the toes. The movable head piece of the steodiometer was lowered and firmly pressed on the hair and asked to the subject to take a deep breathe. The height was measured the nearest 0.1cm.
3.6.3 Pregnancy records
Pregnancy records were used to collect some information from pregnant mothers. They were pre-pregnancy weight and height and MUAC.
3.6.4 Dietary information
Three day diet diaries and twenty four hour recalls were used to collect dietary information. There three day diet diaries were given to them to record each and every thing that was eaten by them during selected three days in the week. 24 hour recalls were taken in the data collected day to get information about all foods that were eaten by the subject during the day before the interview. They were used to determine their dietary intake. (Three day diet diary is shown in annex III)
3.6.5 Biochemical data
Blood samples were collected only from the subjects who gave the consent to give blood. So, biochemical analysis was done for a sub group of the selected population. For the hemoglobin test drop of blood from a finger was collected to a microcuvette. For the total protein and albumin analysis, 5mL of blood sample was drawn from the cubital vein by a trained person when subject is in the sitting posture. Then blood was transferred to a blood collection tube and it was stored in an ice container until taking them to the laboratory. At the laboratory serum was separated from the collected blood samples by centrifuging. For total protein and albumin analysis serum was separated in 2500 rpm for 15 minutes. Then separated serum was transferred to eppendorf tubes and labeled them. They were stored in -20oC until do the biochemical analysis.
3.6.5.1 Hemoglobin test
Hemoglobin test is used to measure the hemoglobin amount present in blood. It was done using Hb 201+ Homocue. Drop of blood was collected by finger pricking to the microcuvette and hemoglobin level was measured.
3.6.5.2 Total protein analysis
Total serum protein test measures the total protein amount in blood. It also measures the amounts of two major groups of proteins in the blood, albumin and globulin.
3.6.5.2.1 Analytical method
Principle
Proteins are molecules that are included in serum. They react with cupric ions and make a violet colored complex. It is known as the Biuret colour reaction. The intensity of violet color is proportional to the amount of protein present when compared to a solution with known protein concentration.
Protein+ Cu++ coloured complex
Alkali
medium
3.6.5.2.2 Equipment
Spectrophotometer
Jeneway 6305 UV/Visible range spectrophotometer (Jenway Ltd, England)
3.6.5.2.3 Reagents
Reagents were ready to use
Biuret reagent- 50mL six bottles -“bt products”, Reference number-10300
Standard solution (7mg/dl)-“bt products”, Reference number-10300
3.6.5.2.4 Procedure
- Required number of cuvettes were taken and labeled them accordingly.(separate cuvettes for the blank, standard and samples)
- Standard and samples were replicated.
- 1mL of the provided reagent was transferred to each cuvette by a micro pipette.
- Then 20µL of de-ionized water was added to the blank cuvette, 20µL of the standard solution was added to the standard cuvettes and 20µL of the serum sample was added to the sample cuvettes.
- Then each cuvette was mixed thoroughly by a vortex mixture.
- After the mixing they were incubated for five minutes at 37oC temperature.
- Then absorbance was measured by a spectrophotometer in 540nm wave length and total protein amount of a sample was calculated as mentioned below,
3.6.5.2.5 Determination of total protein content
(Absorbance of the sample/ Absorbance of the standard) X
Concentration of the
Standard (g/dl)
3.6.5.2.6 Practical error minimization
All the samples were analyzed by the same person after sufficient practice.
Cuvettes were washed with deionized water and dried them properly after every practical. They were stored in the cuvette holder properly.
3.6.5.2.7 Quality assurance
Equipment- Spectrophotometer, micropipettes were calibrated before the experiment to have an adequate performance.
Reagents- All the reagents and standard bottles were stored in 40C in the refrigerator. All the reagents were kept in the refrigerator after each run.
Samples- Samples were stored in -200C after the serum separation and until use them for total protein analysis. Samples were allowed to thaw before start the analysis.
Quality control- Serum sample with a known protein amount is used for the quality control. Quality control was done between every five samples.
Precision- Each sample was duplicated and the average value was taken. When the differences of duplicates were greater than 0.005 points, it was repeated. Pipetting was practiced before starting the analysis.
3.6.5.3 Albumin analysis
Serum albumin test can be used to determine the albumin amount present in serum.
3.6.5.3.1 Analytical method
Principle
At a controlled pH, bromocresol green (BCG) forms a coloured complex with albumin. The intensity of the colour at 630nm is directly proportional to albumin content.
BCG + Albumin Green BCG/ Albumin complex
Controlled
pH
3.6.5.3.2 Equipment
Spectrophotometer
Jeneway 6305 UV/Visible range spectrophotometer (Jenway Ltd, England).
3.6.5.3.3 Reagents
Reagents were ready to use
BCG reagent – 50mL six bottles-“bt products”, Reference number- ALB-10300
Standard solution (5mg/dl) -“bt products”, Reference number- ALB-10300
3.6.5.3.4 Procedure
Albumin Analysis
- Required number of cuvettes were taken and labeled them accordingly.(separately cuvettes for the blank, standard and samples)
- Samples were replicated.
- 1mL of the provided reagent was transferred to each cuvette by a micro pipette.
- Then 10µL of de-ionized water was added to the blank cuvette, 10µl of the standard solution is added to the standard cuvette and 10µl of the serum sample is added to sample cuvettes.
- Then each cuvette was mixed thoroughly by a vortex mixture.
- After the mixing they were incubated for 90 seconds at 37oC temperature.
- Then absorbance was measured by a spectrophotometer in 630nm wave length and albumin amount of a sample was calculated as mentioned below,
3.6.5.3.5 Determination of Albumin content
(Absorbance of the sample/ Absorbance of the standard) X
Concentration of the
Standard (g/dl)
3.6.5.3.6 Practical error minimization
All the samples were analyzed by the same person after sufficient practice.
Cuvettes were washed with deionized water and dried them properly after every practical. They were stored in the cuvette holder properly.
3.6.5.3.7 Quality assurance
Equipment- Spectrophotometer, micropipettes were calibrated before the experiment to have an adequate performance.
Reagents- All the reagents and standard bottles were stored in 40C in the refrigerator. All the reagents were kept in the refrigerator after each run.
Samples- Samples were stored in -200C after the serum separation and until use them for albumin analysis. Samples were allowed to thaw before start the analysis.
Quality control- Serum sample with a known albumin amount is used for the quality control. Quality control was done between every five samples.
Precision- Each sample was duplicated and the average value was taken. When the differences of duplicates were greater than 0.005 points, it was repeated. Pipetting was practiced before starting the analysis.
3.7 Data analysis
Details in questionnaires were double checked to reduce the incompleteness. Then they were entered to Microsoft excel 2007 worksheet.
3.7.1 Data processing
3.7.1.1 Processing of general characteristics- General information taken from the questionnaire was categorized.
Table 3.2 Categorizing of data obtained from general information of the subject information questionnaire
| Information | Category | |||||
| Age |
| |||||
| Ethnicity |
| |||||
| Education level |
| |||||
| Occupation |
| |||||
| Monthly income (Rs.) Table 3.2 contd….. |
| |||||
| Monthly expenditure for food (Rs.) Engage in home gardening | <5,000 5,000–9,999 10,000–14,999 >15,000 Yes No |
3.7.1.2 Processing of anthropometric and obstetric characteristics- They were entered as numerical values.
Data related to Pregnancy period, Pre-pregnancy weight and height, nutritional status during pregnancy, intake of supplements during pregnancy were collected.
By using pre-pregnancy weight and height, pre-pregnancy BMI was calculated. Based on pre-pregnancy BMI, their nutritional status determined and categorized according to WHO cut-off values
Table 3.3: Nutritional status based on BMI
| Nutritional status | BMI (kg/m2) |
| Underweight | <18.5 |
| Normal | 18.5-24.9 |
| Overweight | 25-29.9 |
| Obese | ≥30 |
(WHO,2004)
3.7.1.3 Processing of dietary patterns, habits and food processing methods- Vegetarianism, food avoidance, food allergies, food cravings, consumption of grains, tea/coffee, fruits and vegetables. Consumption of iodinated salt, cooking oil type and etc.
3.7.1.4 Processing of dietary intake data- Dietary data was collected using three day diet diaries and 24 hour recalls. In each diet diary and 24 hour recall portion sizes were converted to grams using a gram conversion table. Then they were entered to foodbase2000 software (The institute of biochemistry and Human Nutrition, University of North London), modified version with Sri-Lankan foods. Then dietary intakes for energy, macro-nutrients and micro-nutrients were taken. They were compared with RDA for Sri-Lankans
3.7.1.5 Processing of biochemical data- Hemoglobin level, serum total protein content, serum albumin content was entered to an excel sheet according to the respective subject. Average values were obtained from each duplicate. Values taken from biochemical analysis were compared with dietary intake data.
Table 3.4: Recommended serum total protein levels during pregnancy
| Level of total serum total protein | Cut-off value* |
| Low level | <6.7g/dl |
| Normal level | 6.7-8.7 g/dl |
| High level | >8.7g/dl |
(*Papadopol, V., Damian, O., Palamaru, I., Adam, C., Florescu, N., Damaceanu, D., (2001). Maternal Haematological and Biochemical Parameters and Pregnancy Outcome. The journal of preventive medicine, 9(3):27-33
Table 3.5: Recommended serum albumin levels during pregnancy
| Level of serum albumin | Cut-off value* |
| Low level | <3.5 g/dl |
| Normal level | 3.5-5.5 g/dl |
| High level | >5.5 g/dl |
(*Papadopol, V., Damian, O., Palamaru, I., Adam, C., Florescu, N., Damaceanu, D., (2001). Maternal Haematological and Biochemical Parameters and Pregnancy Outcome. The journal of preventive medicine, 9(3):27-33
3.8 Statistical analysis
Microsoft Excel 2010 software – To find Simple descriptive statistics (mean values, standard deviation and percentages) were used to characterize the sample. The categorical variables were tabulated and reported as frequencies with their respective percentages. Continuous variables were summarized as means with their standard deviation and ranges.
SPSS 20 software – Linear regression, Pearson correlation was used to determine the relationships between variables. Coefficients were then determined with their respective 95% confidence intervals.
04. Results
4.1 Socio-demographic characteristics of the study sample
Table 4.1 Distribution of pregnant women by their socio-demographic characteristics
| Variable | Number (%) | Mean±SD |
| Age (years) <18 19-25 26-35 >35 | 2(1.34) 60(40) 84(56) 4(2.67) | 26±4.58 |
| Ethnicity Sinhala Muslim | 141(94) 9(6) | |
| Educational level Grade 6-11 Grade 12-13 Degree/diploma | 77(51.3) 66(44) 7(4.67) | |
| Occupation Employed Government Semi-government Private Self-employed Unemployed | 26(17.3) 3(2) 21(14) 2(1.34) 98(65.3) | |
| Monthly family income(Rs.) <10,000 10,000-14,999 15,000-24,999 >25,000 | 1(0.67) 6(4) 21(14) 122(81.34) | |
| Engage in home gardening Yes No | 54(36) 96(64) |
This study sample included 150 pregnant women. Table 4.1 shows the socio-demographic characteristics of them. The age range of the study sample was 17 to 38 years and majority (56%) was in the 26-35 year age category. The mean age of the study sample was 26±4.58 years. Most of the subjects (94%) were Sinhalese. Majority of the sample (51.3%) had studied up to grade eleven while 44% of them had studied up to grade 13. 42% of the study sample were having only one child and majority (65.34%) of them were unemployed. 81.34% of the subjects were having a monthly family income above than Rs.25, 000. 36.67% of the subjects were spending more than Rs.15, 000 per month for foods and more than half of the sample (64%) were not engaging in home gardening.
4.2 Anthropometric characteristics of the study sample
Table 4.2 Distribution of pregnant women by anthropometric characteristics
| Variable | Number (%) | Mean±SD | Range |
| Pregnancy period (n=150) 2nd trimester 3rd trimester Maternal height (n=127) ≤145 >145 MUAC*(n=62) ≤23cm >23 | 106(70.6) 44(29.3) 7(5.5) 120(94.5) 7(11) 55(89) | 154.25±5.9 27.75±3.95 | 148.35 – 160.15 23.8 – 31.7 |
| Pre-pregnancy BMI (kg/m2) (n=101) Underweight (<18.5) Normal (18.5-24.9) Overweight (25-29.9) Obese (≥30) | 29(28.7) 57(56.4) 11(10.9) 4(3.96) | 21.95±3.89 | 18.06 – 25.84 |
(*MRI,2010)
Table 4.2 shows the anthropometric characteristics of the study sample. Majority (70.66%) of them were in the second trimester and majority of them (94.5%) were having a height above than 145 cm. Based on their pre-pregnancy BMI, 56.43% of them were in the normal nutritional status.
4.3 Dietary information and habits of the study sample
Table 4.3 Distribution of pregnant women by dietary information and habits (n=150)
| Variable | Number | % | |||
| Vegetarianism Yes No | 8 142 | 5.34 94.67 | |||
| Food avoidance due to pregnancy No Yes | 129 21 | 86 14 | |||
| Food avoidance due to cultural beliefs Yes No | 14 136 | 9.34 90.67 | |||
| Food allergies Yes No | 9 141 | 6 94 | |||
| Food cravings Yes No | 3 147 | 2 98 | |||
Table 4.3 shows about dietary information and habits of the study sample. 94.67% of them were not vegetarians. 90.67% of them were not avoiding any food due to cultural beliefs and 94% of them were not having food allergies.
4.4 Biochemical characteristics of the study sample
Table 4.4 Distribution of biochemical characteristics of the study sample
| Biochemical variable | Number (%) | Mean±SD |
| Serum total protein level* (g/dL)n=64 Low level (<6.7g/dL) Normal level (6.7-8.7g/dL) High level (>8.7 g/dL) | 9(14.06) 51(79.68) 4(6.25) | 7.45±0.9 |
| Serum albumin level* (g/dL)n=72 Low level (<3.5 g/dL) Normal level (3.5-5.5g/dL) High level (>5.5g/dL) | 2 (2.78) 66 (91.67) 4 (5.56) | 4.55±0.62 |
| Blood hemoglobin level** (g/dL) No anemia ( ≥ 11g/dL) Mild anemia (10-10.9g/dL) Moderate anemia (7-9.9g/dL) Severe anemia (<7g/dL) | 62 (74.69) 17 (20.48) 4 (4.8) | 11.56±1.03 |
(*Papadopol, V., Damian, O., Palamaru, I., Adam, C., Florescu, N., Damaceanu, D., (2001). Maternal Haematological and Biochemical Parameters and Pregnancy Outcome. The journal of preventive medicine, 9(3):27-33
**source: WHO, 2007)
Table 4.5 shows biochemical characteristics of the study sample. Majority of them 82.81% of them were having a normal level of serum total protein and the mean serum total protein level was 7.75±7.45. 65.78% of the study sample were having a normal serum albumin level and the mean serum albumin level was 4.55±0.62. Majority of the study sample (74.69%) were not having anemia and mean hemoglobin level was 11.56±1.03.
4.5 Dietary Nutrient intake of the study sample
Table 4.5 Distribution of mean daily dietary nutrient intake in the study sample (n=)
| Nutrient (units) | Intake from diet Mean (±SD) | RDA * | Daily intake from supplements | Above RDA % (n) | Below RDA % (n) |
| Energy(kcal) | 2383.34 ± 556.64 | 2360** | 21.62 (16) | 78.37 (58) | |
| Carbohydrates(g) | 380 ± 89.70 | 175** | 98.64 (73) | 1.35 (1) | |
| Protein(g) | 63.7 ± 23.33 | 52 | 51.35 (38) | 48.64 (36) | |
| Iron(mg) | 15.56 ± 5.14 | 33 | 60 | 1.35 (1) | 98.64 (73) |
| Calcium(mg) | 632.3 ± 228.67 | 750 | 600 | 27.02(20) | 72.97 (54) |
| Iodine (µg) | 62.55 ± 18.35 | 250 | 0 | 100 (74) | |
| Folic acid (µg) | 226.53±85.76 | 600 | 1000 | 0 | 100(74) |
| Vitamin C(mg) | 47.87 ± 32.91 | 58 | 100 | 25.67 (19) | 74.32 (55) |
| Vitamin A(µg) | 439.7 ± 214.54 | 800 | 6.75 (5) | 93.24 (69) |
(* Source: Recommended Dietary Allowances for Sri-Lankans, Department of Nutrition, Medical Research Institute, Colombo, 2007)
(** Source: Food and Nutrition Board, Institute of Medicine, National Academics, 2011)
Table 4.6 shows that mean energy, carbohydrate, protein and micronutrient intake and RDA for pregnant women. Only mean intake of energy, carbohydrate and protein was higher than RDA. Micronutrients: iron, calcium, iodine, folic acid, vitamin C and vitamin A intake was lower than RDA.
4.6 Energy contribution from each macronutrient
Table 4.6: Contribution of energy from macronutrients and acceptable macronutrient distribution range
| Macronutrient | Mean intake | Contribution for energy (%) | Acceptable energy distribution range* (%) |
| Carbohydrates | 380g | 63.78 | 45-65 |
| Protein | 63.7g | 10.7 | 10-35 |
| Fat | 63.81g | 25.5 | 20-35 |
*Source: Food and Nutrition Board, Institute of Medicine, National Academics, 2011
Table 4.6 shows the energy contribution from macronutrients. Energy distribution of carbohydrates, protein and fat are in the acceptable range.
05. Discussion
The objectives of this study were to assess the dietary intake and effects on nutritional status of pregnant women. This study was conducted as a cross-sectional study in Pannala and Kuliyapitiya (West) MOH areas. Data collection was done using an interweaver administered questionnaire, pregnancy records, three day diet diaries, 24 hour recalls and biochemical tests.
According to the socio-demographic information obtained through the study, majority of pregnant mothers were in the 26-35 age category (56%). Their mean age was 26 year. When consider about their educational level, it is important to get knowledge about nutritional requirements and importance of having an adequate nutrition during pregnancy. Other than that educational level of the mother may increase the household food consumption and food security level of the family. All most all mothers of the study sample had completed their school education, but nearly half of them had studied up to GCE/OL (51.3%). A study done in Northern province revealed that30.4% had studied up to GCE/OL (Sivaganesh and Senarath, 2009). When compare the findings of two studies, Pannala and Kuliyapitiya (West) MOH areas are having a better educational status than Northern province. 65% of pregnant mothers were not employed while others were employed. Therefore majority of them were able to pay more attention about their foods and the changes of the fetus. Also, 81% of them were having a monthly family income more than Rs. 25,000 and so, they were able to spend money for nutritious foods needed during this period. Mean household income per month in Sri-Lanka is Rs. 26,286 (DHS, 2006-7). So, the majority of the study area was able to meet the mean household income per month in Sri-Lanka.
The results obtained from anthropometric characteristics showed that, majority (70.6%) of them were in the second trimester of pregnancy. Maternal height is a critical factor for the determination of off-spring birth weight and height. Maternal height influences offspring linear growth over the growing period (Addo et al., 2013). In this study sample the mean maternal height was 154 cm and majority (94.5%) of them was having a height more than 145 cm. MUAC is also a good determinant to know whether the pregnant mothers are in the normal nutritional status or undernourished. As published by MRI in 2010, MUAC below 23 cm are recognized as undernourished mothers. So, in this study sample, 89% of them were having MUAC more than 23cm and so, they were in the normal nutritional status and 11% of them were having a MUAC below than 23cm and they were recognized as undernourished according to the MUAC. But in Sri-Lanka the prevalence of undernutrition based on MUAC among pregnant mothers is 18.4%. Pre-pregnancy BMI is also a good indicator to assess the nutritional status. In this study sample, 56.4% of them were in the normal BMI range. Also there were some pregnant mothers in the underweight, overweight and obese BMI category as well. The mean BMI in the study sample was 21.95kg/m2 and there were 28% of them are underweight. In Sri-Lanka the prevalence of underweight among pregnant women is 16.2% (DHS, 2006-7). So, the prevalence of underweight among pregnant mothers is higher in Pannala and Kuliyapitiya(West) MOH areas compared to it.
Serum total protein is used to determine the protein status in the body. In here 51% of them were having a normal serum total protein level (6.7-8.7g/dl), while the mean serum total protein status was 7.45g/dl. Determination of serum albumin status revealed that majority (91%) of them was having a normal serum albumin status (3.5-5.5g/dl). The mean albumin level in the study group was 4.55 g/dl. Furthermore, 74.7% of the study sample was having an adequate hemoglobin level in the body (≥11g/dl), while 17% and 4% of them were having mild and moderate anemic conditions respectively. The mean hemoglobin level in the study sample was 11.56g/dl. Another study done in Anuradhapura district (Chathurani et al., 2012) showed the mean hemoglobin concentration as 11.8 g/dl. So, the mean hemoglobin concentration of Pannala and Kuliyapitiya (West) MOH areas were lower compared to Anuradhapura district. In Sri-Lanka the anemia prevalence is 34% (DHS, 2006/07) and the anemia prevalence of selected areas for this study lower.
The results obtained from dietary nutrient intake analysis revealed that, energy, carbohydrates and protein intake is above than the RDA values. But, micronutrients iron, calcium, iodine, folic acid, vitamin C and vitamin A intake was below than RDA. Although they had a higher level of protein intake, they were having a lower iron intake than RDA. It may be due to high intake of plant based protein rich foods such as rice, pulses and legume than consuming animal based protein rich foods such as fish and meat. Because protein rich animal based foods contain more iron than plant based foods. According to another study done for pregnant mothers in Pannala MOH area, they were able to meet RDA of energy, protein and vitamin C (Adikari et al., 2016) and their vitamin C intake was higher compared to this study. It may be due to low consumption of fruits and vegetables. Another important point is that, when they got dietary supplements given by the MCH clinic such as iron, calcium, folic acid and vitamin C, the nutrient intake for these nutrients elevates above than RDA. Taking iron supplements may be a reason to having an adequate hemoglobin status in the study sample, although their low iron intake in the diet. Another important point revealed from this study was about the energy contribution from macronutrients. It showed that the energy contribution from carbohydrates, protein and fat were in the acceptable range. They were 63.7%, 10.7% and 25.5% respectively.
In the determination of the effect of dietary intake on the nutritional status of pregnant women, there was a positive effect by carbohydrates on MUAC, protein on pre-pregnancy BMI, Hemoglobin, serum total protein and albumin status. Also, iron intake positively effects with hemoglobin and serum total protein levels and calcium intake effects on serum total protein level. So, nutrients included in the diet affects with the nutritional status of pregnant women. Nutritional status is a major determinant of the developing fetus. As example, maternal hemoglobin level positively correlates with newborn length (Papadopol et al., 2001). Also literature data says there is relationship between maternal protein levels and newborn weight (Kalhan, 2000). According to the results obtained from this study, having an adequate diet during pregnancy is a must because it affects with the nutritional status.
Conclusions
- Although the mean dietary intake of energy, carbohydrates and protein were above than RDA, dietary intakes of micronutrients were lower than RDA.
- Hemoglobin, serum total protein and albumin status of the study sample were in the normal range.
- There was an effect on MUAC from the carbohydrate intake and there were effects on pre-pregnancy BMI, hemoglobin, serum total protein and albumin levels from the protein intake. Also, iron intake positively effects with hemoglobin and serum total protein levels and calcium intake effects on serum total protein level.
- There is an effect from dietary intake on the maternal nutritional status.
Limitations
- Poor co-operation of pregnant mothers in data collection.
- Information obtained from mothers may not be accurate.
- Biochemical and dietary intake data were obtained only from a sub sample.
- Lack of time.
References
Abu-Saad, K. Fraser, D.( 2010). Maternal Nutrition and Birth Outcomes. Epidemiologic Reviews. 32 (1): 5-25. doi: 10.1093/epirev/mxq001
Addo, O. Y., Stein, A. D., Fall, C. H., Gigante, D. P., Guntupalli, A. M., Horta, B. L. Consortium on Health Orientated Research in Transitional Societies Group. (2013).Maternal Height and Child Growth Patterns. The Journal of Pediatrics. 163(2), 549–554.
Adikari, A.M.N.T., Sivakanesan, R., Wijesinghe, D.G.N.G., Liyanage, C., (2016). Assessment of Nutritional status of Pregnant Women in a Rural Area in Sri-Lanka. Tropical Agricultural Research. 27(2), 203-211
Arulkumaran, S. (2009). Nutrition in Pregnancy. [online] Switzerland: Paula and David Bloomer. Available from: https://www.glowm.com/section_view/heading/Nutrition%20in%20Pregnancy/item/97#23981. [Accessed: 6th June 2017]
Bhandari, S., Sayami, J.T.,Thapa, P.,Sayami, M.,Kandel, B.P.,Banjara1,M.R.,(2016). Dietary intake patterns and nutritional status of women of reproductive age in Nepal: findings from a health survey. Archieves of Public Health. 74:2
Begum, J.A., Sultana, R., Naher, S., (2010). Serum Levels of Total Protein, Albumin and Globulin in woman with Hyperemesis Gravidarum, Journal of Dhaka Med Coll. 19(1), 58-60
Carvalho, P.D., Accioly, E., Libera, B.D., Chagas, C., Saunders, C.(2009). Anthropometric assessment of nutritional status in Brazilian pregnant women. Rev Panam Salud Publica. [online]. 25(2), pp.171-178, viewed 7th June 2017. (http://dx.doi.org/10.1590/S1020-49892009000200011)
U Chathurani, U., Dharshika, I., Galgamuwa, D.,Wickramasinghe, N.D.,Agampodi, T.C.,Agampodi, S.B., (2012). Anaemia in pregnancy in the district of Anuradhapura, Sri-Lanka – need for updating prevalence data and screening strategies. Ceylon Meddical Journal. 57(3), 101-106
Chowdhury, H.A. Ahmed, K.R. Jebunessa, F. Akter, J. Hossain, S. (2015). Factors associated with maternal anemia among pregnant women in Dhaka city. BMC Women’s Health, 15(1), pp.77-83
Daba, G. Beyene, F. Garoma, W. Fekadu, H. (2013).Assessment of Nutritional Practices of Pregnant Mothers on Maternal Nutrition and Associated Factors in Guto Gida Woreda, East Wollega Zone, Ethiopia. Science, Technology and Arts Research Journal. 2(3): pp;105-113
Department of Census and Statistics Sri Lanka. (2009). Demographic and Health Survey
2006/7 Colombo, Sri Lanka. Department of Census and Statistics in collaboration with
Ministry of Healthcare and Nutrition Sri Lanka
Department of Nutrition, Medical Research Institute (2007). Recommended Dietary Allowances for Sri-Lankans. Colombo
DoveMed. (2016). Total Serum Protein with Albumin/Globulin Ratio[Online], Available from: http://www.dovemed.com/total-serum-protein-with-albuminglobulin-ratio/, Accessed on 6th June 2017
Dreyfuss, M. L., Stoltzfus, R. J., Shrestha, J. B., Pradhan, E. K., LeClerq, S. C., Khatry, S. K., Shrestha, S. R., Katz, J., Aolbonico, M. & West, K. P. (2000). Hookworms, malaria and vitamin A deficiency contribute to anemia and iron deficiency among pregnant women in the plains of Nepal. The Journal of Nutrition. 130(10). pp: 2527–2536.
Gernand, A. D. Schulze, K. J. Stewart, C. P. West, K. P. & Christian, P. (2016). Micronutrient deficiencies in pregnancy worldwide: health effects and prevention. Nature Reviews. Endocrinology, [online] 12(5), p. 274–289. Available at: http://doi.org/10.1038/nrendo.2016.37 [Accessedon: 5th May 2017]
Fall, C.H., Yajnik, C.S., Rao, S., (2003). Micronutrients and fetal growth. J Nutr . 133(5), 1747S–1756S.
Family Health Bureau. (2017). National Statistics. [online]Available at: http://fhb.health.gov.lk/web/index.php?option=com_statistics&view=islandwideallresult&Itemid=134&lang=en [Accessed on: 6th May 2017]
Food and Nutrition Board, Institute of Medicine, National Academies. (2009). Weight Gain During Pregnancy: Reexamining the Guidelines. Washington: National Academy press
Food and Nutrition Board, Institute of Medicine, National Academies. (2011). Recommended
Daily Allowances. Washington: National Academy press.
Gunawardhana, D., (2011). Nutritional Interventions [online]. Available at : https://www.slideshare.net/damithagunawardane/nutritional-interventions?from_action=save. Accessed on 30th May 2017
Hettiarachchi, M., (2013). Improving micronutrient status of the Sri Lankan population: effect of iron and zinc fortified rice flour. Ruhuna Journal of Medicine .1(1). 23-33
Jayawardena, R., (2016). Comparison dietary assessment methods in Sri-Lankan adults: use of 24-hour dietary recall and 7-day weighed intake. BMC Nutrition [online] .Available at: https://bmcnutr.biomedcentral.com/track/pdf/10.1186/s40795-016-0059-5?site=bmcnutr.biomedcentral.com [Accessed on: 7th August 2017]
Kalhan, S.C. (2000). Protein metabolism in pregnancy. Am J Clin Nutr;71:1249S–55S
Kamau- Mbuthia, E., Elmadfa, L., (2007). Diet quality of pregnant women attending an antenatal clinic in Nakuru, Kenya. Annals of Nutrition Metabolism 51(4), 324-330.
King, J.C., (2003). The Risk of Maternal Nutritional Depletion and Poor Outcomes Increases in Early or Closely Spaced Pregnancies.The Journal of Nutrition [online] 133( 5), 1732S-1736S. Viewed on 5th June 2017, Available from : http://jn.nutrition.org/content/133/5/1732S.
Kinney, J., (2000). Loosening the Grip: a handbook of alcohol information, sixth edition, McGraw- Hill Higher Education USA.
Ladipo, O.A., (2000). Nutrition in pregnancy: mineral and vitamin supplements. Am J Clin Nutr. 72(1), 280s-290s
Latham, M.C. (2004). Human Nutrition in the Developing world. [online] Newyork. David Lubin Memorial Library Cataloguing in Publication. Available from: http://www.fao.org/docrep/w0073e/w0073e00.htm. [Accessed : 5th May 2017]
Lee, H.S., Kim, M.S., Kim, M.H., Kim, Y.J., Kim,W.Y., (2006). Iron status and its association with pregnancy outcome in Korean pregnant women. European Journal of Clinical Nutrition, 60, pp; 1130–1135
Malkanthi, R.L.D.K. Silva, K.D.R.R. Chandrasekara, G.A.P. Jayasinghe, J.M.U.K. (2007). High Prevalance of Malnutrition and Household Food Insecurity in the Rural Subsistence Paddy Farming Sector. Tropical Agricultural Research. 19, pp.136-149
MCH Quarterly (2014). Prevention and Control of Micronutrient Deficiencies in Sri-Lanka [online]. Available at: www.familyhealth.gov.lk. [accessed on: 8th April 2017]
Medical Research Institute (2010). Nutrition and Food Security Assessmment in Sri-Lanka. Colombo
Ota, E. Haruna, M. Suzuki, M. Anh, D. Tho, L. Thiem, D. Anh, N. Isozaki, M. Shibuya, K. Murashima, S. Moriuchi, H & Yanai, Hi . (2010) Maternal body mass index and gestational weight gain and their association with perinatal outcomes in Viet Nam. Bulletin of the World Health Oraganization. 89(2), 81-160, Available at : http://www.who.int/bulletin/volumes/89/2/10-077982/en/ [Accessed on : 7th August 2017]
Palihawadana, T.S., Goonawardene, I.M.R., Motha, M.B.C., Williams, H.S.A., (2014). Iron Deficiency Anemia in Pregnancy: Diagnosis, Prevention and treatment. Sri Lanka Journal of Obstetrics and Gynaecology. 61-65
Papadopol, V., Damian, O., Palamaru, I.,Adam, C., Florescu, N., Dămăceanu, D., (2001). Maternal Hematological and Biochemical Parameters and Pregnancy Outcome. The Journal of Preventive Medicine. 9(3), 27-33
Raza,N. Sarwar,I. Munazza,B. Ayub,M. Suleman,M. (2001). Assessment of Iron Deficiency in Pregnant Women by Determining Iron Status. J Ayub Med Coll Abbottabad. 23(2), pp.36-40
Sivaganesh, S., and Senarath, U., (2009).Prevalence of antenatal risk conditions among
women in an underserved district of Northern Sri Lanka. Ceylon Medical Journal. 54(4). pp 110-115
Tang.M., Chung, M.,Dong,K.,Terrin,N., Edmonds, A., Assefa,N., Chetty,T., Ramlal,R., Christian,P., West,K., Janjua,N., Wanke,C., Deitchler,M., Manasseh,Z.( 2016). Determining a Global MidUpper Arm Circumference Cutoff to Assess Malnutrition in Pregnant Women, DC: FHI 360/Food and Nutrition Technical Assistance III Project (FANTA). Washington
Thangaratinam, S., Rogozinska, E., Jolly, K., Glinkowski, S., Tomlinson, J.W. (2012). Effects of interventions in pregnancy on maternal weight and obstetric outcomes: meta-analysis of randomized evidence. BMJ. 34, pp: 1-15
Thomas, R., Tembo, M., Soko, A., Chigwenembe, M., Ellington, S., Kayira, D. (2012). Maternal mid-upper arm circumference is associated with birth weight among HIV-infected Malawians. Nutrition in Clinical Practice : Official Publication of the American Society for Parenteral and Enteral Nutrition, 27(3), 416–421, Viewed on 5th July 2017, Available at: http://doi.org/10.1177/0884533611435991
Torheim, L.E., Ferguson, E.L., Penrose, K., Arimond, M., (2010). Women in resource-poor settings are at risk of inadequate intakes of multiple micronutrients.J Nutr. 140(11), 2051S-8S.
Ugwa, E. (2016). Nutritional Practices and Taboos among Pregnant Women Attending Antenatal Care at General Hospital in Kano, Northwest Nigeria. Annals of Medical and Health Sciences Research, 6(2), 109–114, Viewed: 15th May 2017, (http://doi.org/10.4103/2141-9248.181846)
WHO, (2017). Health topics, Pregnancy. [Online] Available at: http://www.who.int/topics/pregnancy/en/ [Accessed on:5th May 2017]
Annex I
Department of Applied Nutrition,
Date: ……………………………..
Ref. no. : …………………………
MOH Clinic: ……………………..
Faculty of Livestock, Fisheries and nutrition,
Wayamba University of Sri-Lanka
Makandura, Gonawila
Information sheet
The research on Effects of Dietary Intake on Maternal Nutritional Status
Researchers,
Contact
Senior Lecturer, Mrs. A.M.N.T Adikari,
Mobile No- 0714411487
Email- thakshila.adikari@yahoo.com
D.S Jayasuriya,
Mobile No- 0712474416
Email- dewni.jayasuriya@gmail.com
Mrs. A.M.N.T Adikari,
Senior Lecturer,
Department of Applied Nutrition,
Faculty of Livestock, Fisheries and nutrition,
Wayamba University of Sri-Lanka
Makandura, Gonawila
D.S Jayasuriya
Research student,
Department of Applied Nutrition,
Faculty of Livestock, Fisheries and nutrition,
Wayamba University of Sri-Lanka
Makandura, Gonawila
Introduction
Pregnancy is an important period of a woman’s life cycle. Proper nutrition during this period is a main reason to have a healthy baby. Essential nutrients should be taken during that period correctly. Protein, Carbohydrates, Iron, Iodine, Vitamin A, Vitamin C, Folate are some critical nutrients needed during pregnancy. According to the statistics of world health organization in 2011, 25% mothers in Sri-Lanka are suffering from iron deficiency anemia. Due to iron deficiency there can be a lot of impairments of brain and motor skill development of the baby. Protein deficiency during pregnancy is a reason to have low birth weight and reduce immune system functions.
Considering those reports and statistics, Wayamba University of Sri-Lanka is going to conduct a research. You can participate with this research and can aware about your nutritional problems and have solutions for them. If you are willing to participate with us for this research you can read this information sheet and you can ask further information from above researchers.
Who can participate for this research?
Pregnant mothers who registered to maternal clinics and attending to them continuously.
What is happening in this research?
At the beginning, anthropometric parameters such as height and weight are measured. Further, three day diet diary is given to you to fill the things that you ate in three days and instructions will be given to fill it. From that, the nutrients contained in your diet are analyzed. And also five milliliters of blood sample is drawn from your cubitall vein by a qualified person. It is used to analyze the biochemical parameters such as total protein and albumin present in your blood. A small drop of blood will be obtained by finger pricking. That may be used for the hemoglobin analysis.
If you are selected to the research, what you have to do?
We will take your anthropometric parameters (weight, height), socio-economic data, foods that you are consuming generally and one milliliter of blood sample. There, we hope your kind corporation.
There is no need to change your usual life style
You can follow your usual life style and you can follow your usual dietary patterns during the research period.
What we are going to do from the data that are collected from you?
We hope to give you a report regarding your nutritional status and we hope to help you in your nutritional problems. The things that we find from this research will be published in scientific papers, magazines and conferences.
Are there any impacts to your health by participating for this?
No there are no any bad effects to your health.
You have to sign for the consent form if you are willing to participate for this.
This is done with your voluntary participation. Anytime you can give up this and only your consent is taken from signing to the consent form.
Privacy of the information will be assured.
The data collected from this research are protected and each and every person is named using a code. Your names will not be appeared in reports that are published
Thank you for your corporation
Department of Applied Nutrition
Faculty of Livestock, Fisheries and Nutrition
Wayamba University of Sri Lanka
The research on Effects of Dietary Intake on Maternal Nutritional Status
Consent form
- I have read information sheet with regard to the study on the Dietary intake and its effects on Iron and protein status of pregnant women.
- They have explained me the purpose, and importance of the study and I understand what is required from me. I have been answered satisfactorily for the questions I raised and I agree for the procedures described in the information sheet which relates to my participation.
- I understand that I can withdraw from the study at any point without giving reasons and I know that it will not affect me what so ever.
- I give my permission to take my anthropometric parameters such as height and weight, socio-economic data, general information and 5mL of my blood sample.
- I have received a copy of this consent form and information sheet.
- I understand that the participation is entirely voluntary and the information they collect is with my consent.
Name: ……………………………………………………………………………
Name of the MCH clinic…………………………………………………………
Date: …..…………………………………………………………………………
Annex II Department of Applied Nutrition
Faculty of Livestock, Fisheries and Nutrition
Wayamba University of Sri Lanka
The research on Effects of Dietary Intake on Maternal Nutritional Status
Subject information questionnaire
- General characteristics of pregnant women.
| No | Characteristics | Responses | ||||||||||||||||||
| 1.1 | Name of pregnant women Present address Telephone No | ……………………………………………………………….. …………………………………..…………………………… Home …………..…………… Mobile……………………….. | ||||||||||||||||||
| 1.2 | Date of birth & Age | ……/……/……….. Age……… | ||||||||||||||||||
| 1.3 | No of family members | …….. Children……………. | ||||||||||||||||||
| 1.4 | Ethnicity | Sinhala Tamil Muslim Other | ||||||||||||||||||
| 1.5 | Educational level |
| ||||||||||||||||||
| 1.6 | Occupation | Pregnant women…………………………. Monthly salary…………….Rs. | ||||||||||||||||||
| 1.7 | Do you have home garden? Yes No | If yes, what are the vegetables, fruits and others cultivated in your home garden? ……………………………………………………………………. | ||||||||||||||||||
| 1.8 | Do you engaged with animal husbandry? | If yes, Poultry cattle goat | ||||||||||||||||||
| 1.9 | Monthly family income(Rs.) Monthly expenditure for food | <10,000 10,000 – 15,000 15,0000 – 25,000 >25,000 Rs. …………………….. |
- Obstetric characteristics and Anthropometry
| No | Characteristics | Responses |
| 2.0 | Physical measurements | Weight …… Height……… BMI….. Pre-pregnancy weight…….… height…..…… BMI……. |
| 2.1 | Pregnancy week Hemoglobin level | ……….weeks ……………………. |
| 2.2 | Maternal health problems | Underweight Overweight Diabetics Heart disease Renal disease Others……… |
| 2.5 | Do you avoid some food items due to the maternal health problems | Yes No If yes what are the food items? ………………………… |
| 2.6 | Do you take supplements given by the maternal clinics? Yes No Do you take any supplement other than from the clinic? Yes No | If yes what are they? ………………………………………………. |
| Amount you take iron tablets per day is…………. You get iron tablets, Before a main meal After a main meal With a main meal 2-3 hours after a main meal | ||
| 2.7 | Do you receive Thriposha from the maternal clinic? Yes No | If yes, frequency of having thriposha is Once per day Twice per day 3 times per day or more Do not take thriposha daily What is the amount of thriposha that you take for one time? ………………………………………………. What is the method that you use to prepare thiposha? Make Aggala with coconut scrapes and sugar Mix with water and milk Mix with rotti, pittu or another food Another method………………………………….. |
| No | Characteristics | Responses |
| 3.1 | Are you a vegetarian? Yes No | If yes what type of vegetarianism? ………………………………………………………. |
| 3.2 | Do you have food allergies? Yes No | If yes what are the food allergies? ………………………………………………………. |
| 3.3 | Do you have food avoidance due to cultural practices/ myths? Yes No | If yes what food and give reason? ……………………………………………………………………………… ………………………………………………………… |
| 3.4 | Do you have food cravings? Yes No | If yes what are the food? ……………………………………………………… |
| 3.5 | Do you skip meals? Yes No | If yes, Breakfast Lunch Dinner |
| 3.6 | Do you have any cereal other than rice? Yes No | If yes, What are they? …………………………………………………………………. |
| 3.7 | Do you drink tea / coffee? Yes No | If yes, numbers of cups that you take per day?…………….. When do you have it? Morning With a main meal or just before a main meal Between main meals |
- Present dietary practices/ food habits & believes
- Information on food preparation
| 5.1 | Form of the consumption of green leafy vegetables? | Raw Cooked |
| 5.2 | What are the other ingredients that you add to green leafy vegetables when you cook? | Scraped coconut Maldive fish/Sprats/ Dry fish Lime Nothing above Other |
| 5.3 | When do you wash raw vegetables before cooking? | Before cut After cut |
| 5.4 | Do you iodize salt to your food items? Yes No | If yes, when you add? During cooking After cooking |
| 5.5 | Which oil do you use for cooking? | ……………………………….. |
Thank you!
Annex III Department of Applied Nutrition
Date: ……………………………..
Ref. no. : …………………………
MOH Clinic: ……………………..
Faculty of Livestock, Fisheries and Nutrition
Wayamba University of Sri Lanka
Makandura, Gonawila
The research on Effects of Dietary Intake on Maternal Nutritional Status
Three day diet diary
Name-…………………………………………………………………………….
Address-…………………………………………………………………………..
Telephone Number-……………………………….………………………………
Date (Diet diary provided)-……………………………..…………………………
Date (Diet diary returned)-…………………………………………………………
Instructions to fill the Diet diary
- This Diet diary has been prepared to get the information about the foods and beverages (except water) that you consumed throughout the day from wakeup at morning until go to sleep. In the Diet diary you should mention about the foods that you consumed in two week days and one weekend day.
- The amount of foods and beverages you consumed should be mentioned by using house hold measurements such as cup, tea spoon and table spoon.
- Quantity of foods such as fish, meat, pumpkin, polos should be mentioned as small piece( 1/8 of a sunlight soap, medium piece- ¼ of a sunlight piece, large piece- ½ of a sunlight piece)
- Amount of fruit is mentioned as small medium and large
- Vegetables and green leafy vegetables should be mentioned by the measurement of table spoon.
- Rice and pulses such as kadala, cowpea and mung bean should be mentioned by the measurement of cups.
- You should mention about the place where did you consume. e.g. Home / office.
- You should mention about the time when you consumed.
- When you are recording the foods and beverages you consumed, the information about the brand name, preparation method and the variety of food and beverages should be mentioned.
E.g. 1) Variety: – rice – red rice / white rice / parboiled / nadu
pittu / string hoppers – red rice flour / white rice flour
2) Brand: – Margarine – Astra / Canola / Flora
Milk powder – Anchor / Milgro / High land / Raththi / Maliban
Malted drink – Nestomalt / Milo / Viva
3) Preparation method: – Potato and other vegetables – kirata / mirisata
Sprats – tempered / deep fried
Egg – boiled / fried
Green leafy vegetable – mallum / sambol
- Please include if you take any nutrition supplement.
- Read the example below before start to write the diary
Example:-
3 Day diet diary
Day:- Monday Date: – 17/4/2017
| Time | Place | Food items | Amount |
| 6.30 am | Home | Milk tea Anchor milk powder Sugar Tea powder | 1 cup 2 tea spoon 2 tea spoon 1 tea spoon |
| 7.30 am | Home | Milk rice Coconut sambol | 1 cup 1 table spoon |
| 10.30 am | Office | Plain tea Sugar Tea powder Biscuits (munchee cream cracker big) | 1 cup 2 tea spoon 1/2 tea spoon 2 |
| 12.30 pm | Home | White parboiled rice Potato ( mirisata) Dhal curry Mukunuwenna tempred Boiled egg | 2 cups 2 table spoon 1 table spoon 1 table spoon 1 |
| 3.00 pm | Home | Ice-cream (Elephant house, vanilla flavoured) | 1 yogurt cup |
| 4.30 pm | Home | Milk tea Anchor milk powder Sugar Tea powder Biscuits (Munchee chocolate cream) | 1 cup 2 tea spoon 2 tea spoon 1 tea spoon 2 |
| 7.30 pm | Home | Red rice Potato curry (added coconut milk, two medium size pieces and gravy) Salmon tempered Banana ( medium size Kolikuttuu) | 2 cups 1 table spoon 1 medium size 1 |

One comment