
Chapter One – Introduction
1.1 Background of the study
Apparel industry is one of fast growing sector in the industry sector in Sri Lanka. With the new government policy changes and European regulations on GSP +, Apparel industry will have a high level of growth in next few years. Sri Lanka’s apparel industry has the competitive advantage when compared to the other apparel manufacturers in Asian region. With the factors of quality labor force, speed, quality of the end product etc. Sri Lanka’s apparel industry has the high level of recognition in the whole over the world. Also Sri Lanka is the first country in the South Asian region to establish all supporting functions within the country for the industry such as knitting, design, R&D etc. According to the latest release of Sri Lanka Apparel Exporters Association in the first quarter of year 2016 has 22% growth in the apparel industry against the last year. Also sector is targeting revenue in excess of US$ 6 billion in year 2016. Also there is a potential demand to Sri Lankan brand to enter Africa and Gulf Region in the Year 2017. With this situation apparel manufactures in Sri Lanka need to drive through innovation concepts and business process re – engineering concepts in order to achieve the higher market share in the industry. In this process Innovation is one of the important thing to overcome the strategic drift over the industry.
Hayleys Fabric is one of leading fabric manufacturer in Sri Lanka to be in the top ten of apparel industry. Hayleys Fabric was incorporated in 1992 as Hayleys MGT Knitting & Mills (Pvt) Ltd. The company invested USD 4Mn initially for the operations to begin which is presently located in Narthupana Estate in Horana and it has the most diversified fabric mills. According to the company overview operation in carrying out to knit, dye and finish all types of fabrics such as cottons, cottons blends, polyester, polyester blends, spandex, Lycra, viscose and micro modal with a monthly capacity of 1000 Tons. In 2003 Hayleys Fabric was listed as a public quoted company. The main shareholder of the company is Hayleys PLC. LKR 3.81 Bn is the current market capitalization. The high quality finished fabrics are supplied to the leading customer base consist of Decathlon, George, BHS, ASDA, NEXT, Victoria’s Secret, M&S, Tesco, NIKE & etc. (HF Annual Report, 2015/16)
A revenue of USD 60Mn revenue has been recorded from the account information audited for the year 2015/16. Also company has achieved a positive profit after tax of USD 1.8Mn during the year which was recorded as loss of USD 0.68Mn in last financial year. Year 2014 also was a remarkable year for Hayleys Fabric because the company has privilege to open its own Design Centre early in the year. This has a capacity to produce a wide range of fabrics including their own patented fabric which was named as “Inno”. With this own specialized brand of Hayleys Fabric they have achieved high level of competitive advantage over the competitors. (HF Annual Report, 2015/16)
In the emerging market condition Hayleys Fabric has achieved to gain 23% of market share in the total fabric export industry of Sri Lanka. However the balance market share is grabbed by the apparel industry leaders named Brandix & MAS Holdings.
This research proposal will be carried by selecting H F PLC. According to the result of year 2015/16 Hayleys Fabric consist of 1059 labor force and challenging their capacity to produce 2.5mn meters of fabric per month. Innovative design-to-delivery fabric solution production is the business level approach with principle components in innovation and especial technological and analytical resources that coordinate with the vision, mission and cooperate level strategy aimed on innovation of the establishment. Hayleys Fabric is well famed in indicating all trade constituents in such a manner conveying cooperate level and business level objectives in terms of assets, operation and individuals through its operational approach. (HF Annual Report, 2015/16)
Hayleys Fabric has been restated their vision “to be the most sought after manufacturer of fabric in South Asia”. Also Hayleys Fabric main strategies are considered as ‘do the right thing’ -managing with honesty, efficiency, and reliability always / ‘customer decides’ – putting our customer at the center of all our activities / delivering excellent standards consistently / invent in services and technologies to improve on what they do / to build their team to create value to stakeholders / holding their selves responsible to deliver what they promise / caring for the communities in which they work, and being environmentally responsible in all they do. (HF Annual Report, 2015/16).
It is clear that Hayleys Fabric has stated their main strategies to improve their product and service quality by focusing on innovation.
1.2 Research problem identification
1.2.1 Indications and the justification.
Hayleys Fabric has identified as their key competitive advantage for the organization is to retain the business industry by satisfying customer needs through innovation and re-engineering their processes. According to the Hayleys Fabric’s annual report for year 2015/16, it states that future improvements and values in order to achieve corporate, business and operational growth of the company. (HF Annual Report, 2015/16).
Profitability – In order to maximize revenue & PBT of the company focused on high margin polyester and polyester blends.
Figure 1.1: Revenue, PBT and Current & Quick ration analysis FY 2012 – 16
Source: Hayleys Fabric Annual Report FY 2015/16.
Satisfied Customer – Providing high quality products by maximizing the customer need and high level of satisfaction.
Product Innovation – Trough research & development team Organization to produce more innovation solutions to the customers.
Deeper Relationship – focused on improving our supply chain management by emphasizing price, quality, delivery, flexibility and communication.
Employee Productivity – Effective employee engagement & attractive financial & non-financial remuneration. Training & development
Health & Safety
Employee engagement.
Among the above six main strategies of the company main focus has been given to product innovation strategy, Therefore it is really necessary to identify the factors which affect to this innovation culture.When adopting the innovation culture there are several factors are involving. Such as Knowledge management, Management Style & Leadership, Corporate Strategy, Technology, Financial Stability, Attitude of the employees.
When adopting Innovation culture in Hayleys Fabric the above factors can give an impact to the company. As the knowledge management factor Hayleys Fabric need to manage knowledge of the employees in order to develop strategies in innovation culture, if the employees has a good knowledge of the systems and products, then only they can lead their mindset to the innovation thinking. Those innovation practices can lead to the re-engineering of the process of business. (HF Annual Report, 2015/16).
Also the Management style & leadership will have impact on innovation culture, because if the management didn’t lead the employees and the processors to the innovation culture, the Hayleys Fabric will not adopt to the innovation culture. Also the management need to accept what coming up from the employees and they should have the right potential to balance all the concepts and apply the right strategies to the company.
Corporate strategy is a one of main factor to affect when adopting a culture to an organization. Because all the corporate strategies should set to adopt the changes of new culture. When adopting new culture like innovation & process re-engineering. This need to implement correctly because when adopting innovation culture & process re-engineering, In this culture business is doing what they want and get their customers to experience the new products rather than do what they need. High level of failure risk is there. So corporate strategies should set to accept the whole positive and negative outcomes trough out the process.
Technology is also an important factor when adopting innovation and process re-engineering, because Organization technology capabilities should be in line with the new changes and in this culture there can be rapid changes happen in the process. So Hayleys Fabric should have the right potential to accept the rapid changes in the technological improvements.
Financial feasibility is also a one of key factor when adopting a culture to an organization. Because it should have the potential to funding the new changes till it get a positive result from the new culture.
Attitude of the employees is also a significant factor to affect when adopting a new culture like innovation .Because employees are the key factor in the organization when adopting a new culture. If the employees of the Hayleys Fabric accept to adopt this new changes, then only the management can adopt the new culture in the organization.
According to Hayleys Fabrics seven main strategies, one main strategy allocated related to innovation and innovation culture (HF Annual Report, 2015/16). Developing the product level innovation and maximizing the revenue per head using process of innovation and business automation have become the two main strategies to follow. Long term goal of the company, also in the mission statement it’s stated that to captivate premier clothing brands around the world, through innovation, speed, trustworthiness, standard and assistance whilst coordinating our business procedure to meet the expectations of stakeholder. (HF Annual Report, 2015/16).
Hayleys Fabric started to move into innovation on year 2013/14. There is a main goal looking to successfully reach by the company (Hayleys Fabric 2016). Discovering the necessity of the clients and develop in services to upgrade on what we do. Hayleys Fabrics established development facility to design and develop innovative products to achieve this. Hayleys Fabric Innovation is launched in 2013/14 according to this concept. Hayleys Fabric is currently experiencing it’s successfully launched brand fabric – “ Inno” in year 2015. Inno succeeded in attracting key global brands to source fabric from the company and gained recognition for Sri Lanka as an innovative fabric supplier to reckon with.
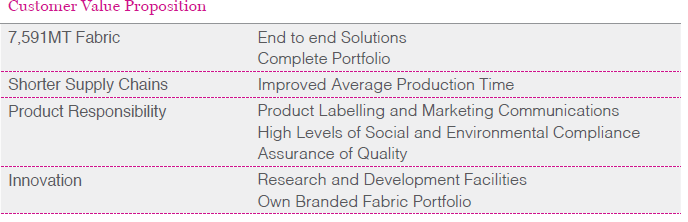 Figure 1.2: Customer Value proposition
Source: Hayleys Fabric Annual Report FY 2015/16.
As shown in the above given table in both manufacturing and development stage the company has growth on innovation product. A rise in the demand of manufacturing process of innovative products should coordinate with new processes. The company is currently engage in product manufacturing and innovation product process. Since the current culture is more a tradition culture it is hard to produce innovation products. Therefore creating innovation culture is the best option for the Hayleys Fabrics PLC.
Innovation Culture is new to the company since company started couple of years back. The factors having impact to the innovative culture needs to be identified initially and prioritize as per the significance to the new method. These indications make it visible that the circumstances which has an effect on innovative culture to the company needs to be identified importantly and this research will make it easier to fulfill this need to the company.
1.2.2 Defining the Research Problem
Innovation has become the key success factor in modern business environment, because most of product and services has come to maturity level of their success, therefore innovation is the best way to survive and grab the market share in the current business world. Apparel industry also faced in this situation in the business environment. H F PLC has recently move to the innovation, In year 2013/14 they have started their own design and innovation center to bring out more efficient and most profitable to market. “Inno” is a one result of this innovation process. H F PLC has faced huge structure change in year 2013 and top management positions have changed due to that. But the all the below position was remained same. Also there were employees who worked with H F PLC for more than 15 years. Supervisor and manual labor level were highly unionized at this time. In this condition top management has started their key changes in strategies in order to lead the company in to success. Innovation is a one of main strategy of the company. But since the company is still in a condition of traditional thoughts it is really hard to moving in to radical changes of the company. Even they success in some innovative products, company culture is still running with traditional thoughts and beliefs. This research will find what factors contribute for adopting of innovation culture in the company.
To conduct this study researcher assume that employees from executive level to senior manager level is suitable, since they are currently move with innovation strategies of the company. This population is around 15% of the total employees. So the sample is selects from this population to carry out the study in order to identify factors contribute for adopting innovation culture at H F PLC.
1.3 Research question
What factors contribute for adoption of an innovation culture at H F PLC?
1.4 Research objectives
General Objective
Factors that influence on Innovation culture – A case study at H F PLC.
Specific Objective
- To explore and determine the factors that contribute for the adoption of an innovation culture.
- To examine & determine the relationship of factors that contribute for the adoption of an innovation culture.
- To investigate and understand the significance of factors that contribute for the adoption of an innovation culture.
1.5 Significance of the study
Adopting innovation and innovation culture have become the main strategy of the companies in the current business environment. Creating a culture is the easiest way to get the maximum outcome trough innovation. Identify the factors which are effect to create this culture is an important task. Once identify these factors it is important to consider while taking strategic decision of the company. Similar studies were done by serval researchers in many industries. Conducting this study by considering H F PLC is the significance of the study. Since H F also new to this innovation it is important to carry out this study considering current nature apparel industry in Sri Lanka.
1.6 Limitation of the study
There are couple of limiting factor in this study. Since time is a limiting factor study is carried out using only one area of responders from the organization. According to the literature review there a lot of variables will affect to the innovation culture. But in this study researcher used only five factors to analyze the relationship.
1.7 Chapter outline
Chapter 1 – This is an introduction to the study. Mainly in this chapter consists of an overview of the company H F PLC and the current nature of the culture. Also this chapter describes the research question, objective of the research. The significance of the research and limitations also a part of chapter one.
Chapter 2 –Main objectives of the chapter two is to find previous studies relate to this topic and objectives. The literature available for this relevant topic are reviewed in this chapter. And existing secondary data has been used to operationalize the adoption of innovation culture and factors affecting in to that. Originality of this research is clearly mentioned at the end of chapter two,
Chapter 3 – This chapter discussed about the research methodology to follow throughout the research. Dependent and independent variable are highlighted in the conceptual framework which is used to test the hypothesis enhanced. The chapter evidently gives an explanation of the population and sampling technique.
Chapter 4 – This chapter add detail to the information received through questionnaire and discussions with few groups of the research topic. There will be comparative analysis between qualitative and quantitative data with the information from the literature review. To simplify the findings of the research Graphical representation will be applied.
Chapter 5 – The final chapter draws conclusion from the previous chapter research summary results and states the recommendations as suggestions.
Chapter Two – Literature Review.
2.1 Introduction
According to the definition of Joseph Schumpeter Innovation is described as the process that firms products, processes or other aspects of the activities which leads to increase the value of the organization. Further to Schumpeter’s definition ‘Value” can be added to the organization by creating more opportunities in below two segments ( Joseph Schumpeter, 1997).
Product Innovation – Introducing the new products to the market or adding more significant value to the current product portfolio of the organization.
Process Innovation – Introducing the new process to the business in order to create or significant value to the business.
Also innovation is described as an essential condition for their business success and rapid increase their product or service portfolio with number of new clients in the current competitive, complex and inconstant business environment (Blayse and Manley, 2004). According to the Damanpour innovative is defines as a reaction creates within the organization to the current changes in the business environment, competitive advantage that creates internally according to the innovative reactions (Damanpour, 1998).
According to the Amabile & Hartmann highlighted that the importance of factors that characterize organizational culture, stimulating creativity, Stimulate innovation and promote the diffusion process (Amabile .,1996, Hartmann, 2016). Further to the Ahmed’s definition, Organizational culture is the main source of the innovation, also culture has the strength of facilitating, controlling the effects on the successful innovation and maintain the quality of the innovation (Ahmed, 1998).
Also in further literature by Martins and Terblanche these effects have generated from socialization movements in organizations. According to this organizations have redefined their basic and typical practices in to activities that reflected as more standardize practices, procedures, policies and structures (Martins and Terblanche, 2003). Further Ahmed’s defines that when employees started accepting such redefined practices and believe that organization value innovation and feel motivated to innovate, those cultural recognition become a necessity to innovative behavior (Ahmed, 1998). According to the above literature Culture plays as a key element of creating innovation in a firm.
2.2 Theoretical Background
As cited by Orla O’Donnell, Richard Boyle (2008), Deal and Kennedy (1982) explains the more observable level of culture such as heroes, rites, rituals, legends and ceremonies. Because these factors are a result of behaviors of the culture or the employees. Further cited by Orla O’Donnell, Richard Boyle (2008), Bradley and Parker’s (2006) proposed the competing value framework of the Organization culture.
Flexibility
Internal
External
Control
Figure 2.1 Competing Value Framework
Source: Cited By Bradly and Parker’s (2006)
This framework has been used to investigate organizational culture in many ways. Also this can be used to create competitive advantage between internal and external environments. According to the literature this value framework has two axis one is vary from Flexibility to Control in between internal and external environment.
According to the above competing value framework internal process model derives that internal control focus as such information management within the organization and communication are utilized to achieve internal stability and control. It is the mainly reflects the traditional and theoretical background of the organization.
Further explanation by Orla O’Donnell, Richard Boyle as cited in Bradley and Parker’s (2006) open system model describes flexibility external focus which mainly focused on adaptability that used for achieve growth , resources acquisition and external support. According to the author this is the culture element that organization need to grab the innovation.
Other two elements are flexibility internal focus which is mainly training and development of the work force in order to success organizational goals. This is mainly refers as group culture. Mainly managers plays main role in this focus as mentors or the motivators of the work force. Also the forth element that is external control element which is mainly plan and develop the organization goals which are utilized to achieve productivity and efficiency (Bradley and Parker, 2006).
According to the Langdon Morris, in creating the innovation culture (2007), stated that innovation culture is also an expression or a reaction of people, like their past behaviors current beliefs and practices. And the same people will make the innovation happen over the time of their journey. The author stated that it is really difficult to create a one in the culture mainly because of the organizations are very rarely see the characteristics and its importance in the existing culture. Further explanation derives that is mainly organizations are love to make profits by keeping current stability and predictability (Morris, 2007).
Further is Morris’s study explains that how the culture and innovation culture differs in mainly the way of thinking or the behavior of the organization.
| Culture elements | Innovation Culture elements | |
| 1. | Predictability | Un-predictability |
| 2. | Seek stability | Seek novelty |
| 3. | Focus on core competence | Focus on edge competence |
| 4. | High success rate | High failure rate |
| 5. | Reinforce the organizational hierarchy | Reinforce organizational networks |
| 6. | Fear the hierarchy | Focus on creative tension |
| 7. | Avoid surprises | Embrace surprises |
| 8. | Focus on inside knowledge | Combine inside and outside knowledge |
| 9. | Easy to live with | Hard to live with |
| 10. | Corporate politics | Moving the cheese |
| 11. | Efficiency through standardization | Efficiency through innovation |
| 12. | Extend the status quo | Abandon the status quo |
| 13. | Avoid change | Embrace change |
| 14. | Measure stability | Measure innovation |
| 15. | Look for data to confirm existing management models | Look for data to contradict existing management models |
| 16. | Look for certainty | Embrace ambiguity |
Table 2.1: Culture and Innovation culture framework
Source: Morris’s (2007)
Also in a different author accepted that organization culture has a significant influence on the innovation of the organization (Tidd et al. 2001). Also McLaughlin in 2008 proposed a diagram to summarize that the basic differences between incremental improvement and radical innovation. It is important to identify the key elements of the incremental change and Innovation culture, this incremental change is refers to the keep the existing culture and adding key improvements to the existing product or services (McLaughlin, 2008).
| Incremental | Radical Innovation | |
| Procedures | Formalized Centralized Systematic | Contingent Decentralized Loosely structured |
| Structure | Functional Efficiency oriented | Facilitating knowledge gathering Supporting risk taking and orientation |
| People | Homogenous Older and experienced | Heterogeneous Younger and entrepreneurial Technical Questioning |
| Aspects of the organization | Mature High inertia Focus on efficiency Focus on team-working Continuous improvement | Entrepreneurial Focus on discovery Individual cooperation Frame-breaking improvement |
| Focus | Cost reduction Feature addition Efficiency improvement | New methods and technologies Experimentation New ideas Creation |
| Product/technologies | Mostly existing | Mostly new |
| Management | Exploitation | Exploration |
Table 2.2 : Incremental and Radical Innovation
Source: (McLaughlin, 2008)
2.3 Culture & innovation culture.
Culture describes in different ways in different literatures. According to Watson concept of culture is explains from a metaphor of the organization and it is something that cultivated (Watson, 2006).
Also Schein describes that culture is the practices and zone that develop within the organization to handle their people or promoted values and explanation of beliefs of an organization. Further Schein highlights that the leaders or the management of the organization has the unique talent to create culture, mange culture or destroy or change it when they see the existing culture is no more valid in the current business society (Schein, 2004).
As cited by Carl John Johansson ALM, Erik Jonsoon (2014), Dobni (2008) in their report culture in an organization is explained as deeply accepted values and beliefs which are accepted by all level of the employees. These values can be listed as symbolism, feelings, relationship, language, behaviors, physical settings etc. in the same literature cited in Barney ( 1986) claims that formation and strategy of an organization is a main element of its culture. Also recommended that it’s really important to understand the formation and strategy when understanding its culture.
Further to above literature the researcher identified that understanding the core value and beliefs is an important task when adopting a cultural change to an organization.
2.4 Current innovation culture in the apparel industry
Late 1970’s Sri Lanka marked a great milestone in apparel industry as well as the export oriented market segment. Due to the economy wise trade liberalization efforts initiated in later half of 1970’s Sri Lanka economy has become a market oriented outward looking economy with manufacturing export quality products. And this start in the apparel industry has become to the leading export turnover contributor to the country (Weerakon, 2006). According to the Ranaweera, apparel industry become the Sri Lanka’s one of the leading contributor to the export revenue (Ranaweera, 2014). Also in a different literature Dheerasinghe stated that 75% of the Sri Lanka’s work force is engage in the apparel industry either directly or indirectly. Further he stated that even if the small and medium firms have engage in the appeal industry, still the industry is dominance by few large firms (Dheerasinghe, 2003).
According to the year 2005 Multi Fiber Agreement (MFA) introduced a secured market in countries in USA, EU and Canada, for countries like Sri Lanka, India, and China & Hong Kong. Also after this industry has shown an 18.5% growth. This growth has been marked a remarkable contribution to GDP, export and foreign exchange earnings (Thilakaratne, 2006).
Further in discussion Ranaweera stated that companies will lose their competitive advantage without working on innovation. Also this innovation is an elemental tool for constant growth even in the difficult times (Ranaweera, 2014).
According to the Goffin and Mitchell there are for important dimension of innovation manufacturing industry. Out of these four elements new product development is the most important factor to the firms in the manufacturing. Also new product innovation is not enough to achieve sustainable competitive growth. Manufacturing organizations needs to improve service innovation as the second element and to succeeding in further firms needs to relook over their process. Finally with all these elements firms needs to give an attention towards business process in order to achieve sustainable growth (Goffin and Mitchell, 2005).
Further to factors and listed down in Textile industry sector report, described that the development of foreign trade and competition from emerging markets have enforced the firms in the appeal industry to divert and recreate their product and services to ensure their survival in the industry. Important factor on this matter is create innovation within themselves. Not only in design of the products, also in cost effectiveness, reliability and so on, This process become a trend in the apparel industry (Leitat, 2013).
Also a different author stated that apparel sector in current market faced huge competition from countries like China, Vietnam because of the low cost strategy. With this apparel companies have been forced to make changes in their firm culture. This can be forms of product, service or the technological changes. (Carolina Klein Padilha, Giancarlo Gomes, cited in Silva Filho & Queiroz, 2010).
2.5 Factors contribute for adoption of innovation culture
Management Style
McLaughlin P. et al. stated that structure of the organization around the employees and the resources made available to the employees and the management style in which the team operate is directly effecting to the innovation culture. Outside of the employees or the team, it requires an external confidence to participate in the innovation process that external confidence is coming from the top management of the organization (McLaughlin, P., Bessant, J. and Smart, P., 2005)
According to the Giancarlo Gomes et al, Organization structure has a direct impact on creating innovation culture. In the authors findings it is further describes that structure of the organization is refers to having team environment in the organization. In the same findings authors derives that this team needs to be form with multi-functional people, which leads to high results on creating innovation culture. Transfer knowledge of functional areas within the team will have a more success in innovation process. (Gomes et al. , 2015).
According to the findings of the Johansson & Jonsson, (2014), management support is essential in order to create ideas and creative vision. Further on discussion state that communicate the expectation, processes and flexibility long term and short term goals will have key connection towards innovation. Accordingly management task is to set the vision and explain in a way that employees can understand. Also cited in Malone (2007). State that it is difficult one leader to complete, therefor it is important to build a culture that leaders and employees work together in a one vision.
Further findings of Johansson & Jonsson, (2014) derives that managers needs to listen and understand to new initiatives to a certain degree.
Accepting Risk
According to the findings of McLaughlin P. et al. Confidence within the employees to taking risks plays a major role in creating innovation culture create a culture to being adventurous, open to new and untried paths and solutions to problems, and to being willing to make and learn from mistakes. It is influenced by the other categories but determines the behavior of the employees when face with choices relating to unknown versus known and therefore safe options. (McLaughlin, P., Bessant, J. and Smart, P., 2005)
According to the previous literature found the relationship between stimulus and formation of innovation culture. And authors stated that stimulus is positively contributes to the creation of innovation culture. In this factor main focus on continues learning to the employees and motivate them to create new ideas in order to success business growth, this encouragement should lead to favor creation without any fear. Freedom to think out of the box and management needs to have ability to take the risk out of this process. (Gomes, Denise and Joaquin Alegre, 2015).
As cited by Siadat et al. (2012) in Ahmed (1998) mentioned that innovation is always follow with inexactness and facing these inexactness, and it is mainly ability take the risk. Further explains that employees will not try innovation or creativeness. Also described that in the culture of innovation organization will have to face several times of failures.
Training & Knowledge Development
Previous research revealed that support mechanism is also have an impact on formation of innovation culture in an organization. According to this variable, describes few sub factors which will directly have an impact on innovation culture. Reward and recognition, Availability of the resources, Technology are the sub factors covers under this variables. (Gomes et al. , 2015).
According to the Gomes, Denise and Joaquin Alegre cited in Saraiva et al. (2005), discussed that employee training and development also important to create competitive within the employees and organization which will lead to innovation in the firm. (Gomes et al., 2015).
Further Siadat et al. (2012) cited in Lao and Ngo (2004) stated that education and training on technical, task oriented, communication and team skills will have a positive impact on innovation performance of the organization.
Team Culture
According to the Siadat et al. (2012) cited in Martins and Terblanche (2003) mentioned that corporative or team such as team with different skills are having a positive impact on creating and innovation in the organization. Also stated that multi discipline team which encourage social and technical interaction between employees.
According to the further literature cited by Siadat et al. (2012) in Ahmed (1998), Employees innovation capability has a positive influence on trust beyond the team and firm. Further explains that cultures with transparent communication based on trust have a relationship on innovation. Further cited in Martins and Terblanche (2003) employees should emotionally confident ad with that able to believe each other to be engage in innovation actives.
Technology & Resources
According to the Johansson & Jonsson, 2014 cited in Hamel & Prahalad (1990) identified first time resources have an influence on innovation as example time, money, machinery & staff etc. Also McLaughlin et al. (2008) stated that resources are critical for the innovation culture of an organization. Further literature cited in Kanter (2000) stated that allocating time and money as the resources will signals to the innovations.
In another literature Giancarlo Gomes, Denise, Joaquin Alegre in 2015 for Brazilian Business Review. Factors which can affect formation of an innovation culture. According to the facts organizational strategy is having positive effect on creating innovation culture. Further the authors describes that inclusion on innovation in the corporate strategy is the main factor of creating innovation culture which is cited in (Martins & Terblanche, 2013).
2.6 Summary of literature review.
| Researcher | Field of Study | Findings |
|
|
|
|
|
|
|
|
|
|
|
|
|
|
|
|
|
|
|
|
|
|
|
|
Table 2.3: Summary of literature review
Source: Research findings
Chapter Three – Research Methodology
3.1 Conceptual Framework of the Research
Main objective of this study is to identify that main factors contribute for adoption of an innovation culture at H F PLC. Based on the findings of the literature review following model has been developed considering the independent and dependent variables.
Dependent Variable
Independent Variable
Factors that influence on innovation culture
Senior Management involvement (SM)
Adopting Innovation Culture (AIC)
Training & knowledge development (TD)
Multi- disciplines teams (MD)
Accepting Risk (AR)
Technology & resources (TR)
The relationship of variables for schedule control can be show as:
| Y (AIC) Dependent Variable | = | FX (SM, TD, MD, AR and TR) Independent Variables |
3.2 Development of Hypotheses
Based on the literature review mostly reviewed factors affecting for adopting of innovation culture have been identified in the conceptual model. Based on the conceptual module following hypothesis were developed in order to investigate the relationship between the selected factors with the dependent variable.
| H1 | H10 | There is no relationship between adoption of innovation culture and senior management involvement |
| H11 | There is a relationship between adoption of innovation culture and senior management involvement | |
| H2 | H20 | There is no relationship between adoption of innovation culture and training and knowledge development |
| H21 | There is a relationship between adoption of innovation culture and training and knowledge development | |
| H3 | H30 | There is no relationship between adoption of innovation culture and multi-disciplines teams |
| H31 | There is a relationship between adoption of innovation culture and multi- disciplines teams | |
| H4 | H40 | There is no relationship between adoption of innovation culture and accepting risk |
| H41 | There is a relationship between adoption of innovation culture and accepting risk | |
| H5 | H50 | There is no relationship between adoption of innovation culture and technology and resources |
| H51 | There is a relationship between adoption of innovation culture and technology and resources |
3.3 Operationalization
According to the defined hypothesis based on the conceptual framework in the above 3.1 chapter the researcher developed the following operationalization table to prepare the questionnaire using key indicators of the key factors. Total of 30 questions were developed to identify the relationship between dependent & independent variables, 5 questions for each variable. Close ended questionnaire developed used with Likert scale from “Strongly Agreed-5” to “Strongly Disagree-1”.
| Variable | Indicators | Measurement | Question No |
| Innovation culture | Involvement of innovation products | Likert Scale (1-5) | 2.1 |
| Change culture | Likert Scale (1-5) | 2.2, 2.3 | |
| Weight from the organization strategies | Likert Scale (1-5) | 2.5, 2.4 | |
| Senior management involvement | Focus for the innovation projects. | Likert Scale (1-5) | 3.1.1 |
| Sponsoring methods. | Likert Scale (1-5) | 3.1.3, 3.1.4, 3.1.5 | |
| Participation | Likert Scale (1-5) | 3.1.2 | |
| Training & knowledge development | Trainings | Likert Scale (1-5) | 3.2.1 |
| Exposure to the other industries | Likert Scale (1-5) | 3.2.2 | |
| Encouragement for the innovation | Likert Scale (1-5) | 3.2.3, 3.2.5 | |
| Time allocation for develop knowledge on innovation | Likert Scale (1-5) | 3.2.4 | |
| Multi- disciplines teams | Different discipline in a team | Likert Scale (1-5) | 3.3.2 |
| Leadership | Likert Scale (1-5) | 3.3.3 | |
| Motivation | Likert Scale (1-5) | 3.3.5 | |
| Team work | Likert Scale (1-5) | 3.3.1, 3.3.4 | |
| Accepting risk | Encouragement for trial and error | Likert Scale (1-5) | 3.4.2 |
| Financial allocation for risk | Likert Scale (1-5) | 3.4.4 | |
| Risk management process | Likert Scale (1-5) | 3.4.1 | |
| Flexible time plan | Likert Scale (1-5) | 3.4.3 | |
| Experience on risk management | Likert Scale (1-5) | 3.4.5 | |
| Technology & Resources | Availability of the current resources | Likert Scale (1-5) | 3.5.1, 3.5.2 |
| Equal distribution of resources. | Likert Scale (1-5) | 3.5.4 | |
| Resources are in line with strategic plan | Likert Scale (1-5) | 3.5.3, 3.5.5 |
3.4 Research design
3.4.1 Population
Total work force of H F PLC is 1,095 as per the details mentioned in the H F PLC annual report 2015/16. From that 916 are fulltime workers and 143 are trainees. The fulltime workers derives in to categories as below.
| Employee Category | No. of employees |
| Manual | 530 |
| Supervisors | 216 |
| Executive & Above | 152 |
| Top Management | 18 |
Considering literature and organizational factors researcher has selected employees of executive & above as the population of the study.
Population Size = 152
3.4.2 Sample
According to the stratified random sampling method, the total sample size is 112 for this study.
Sample Size = 112
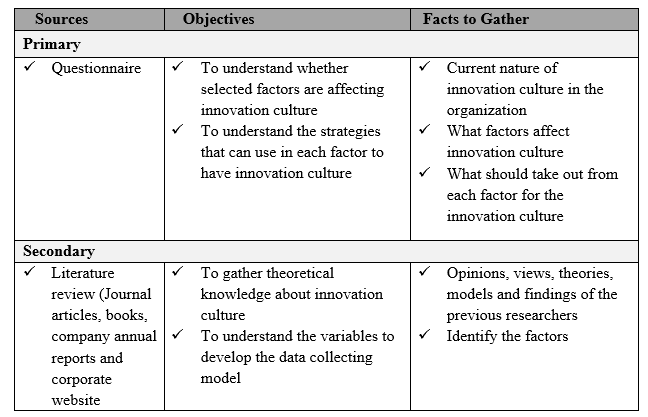
3.5 Methods of data collection
There are two types of data, secondary and primary collected in this research.
3.6 Methods of data analysis
In this study researcher analyzed the data using SPSS software. As defined in the hypothesis in the chapter 3, this analysis carrying to find the relationship with Adopting Innovation Culture ( Dependent Variable ) and Senior management involvement, Training and development, Multi-disciplined teams, Risk taking & Technology and resources which are ( Independent Variables).
Following methods were using to analysis the relationship between the mentioned variables.
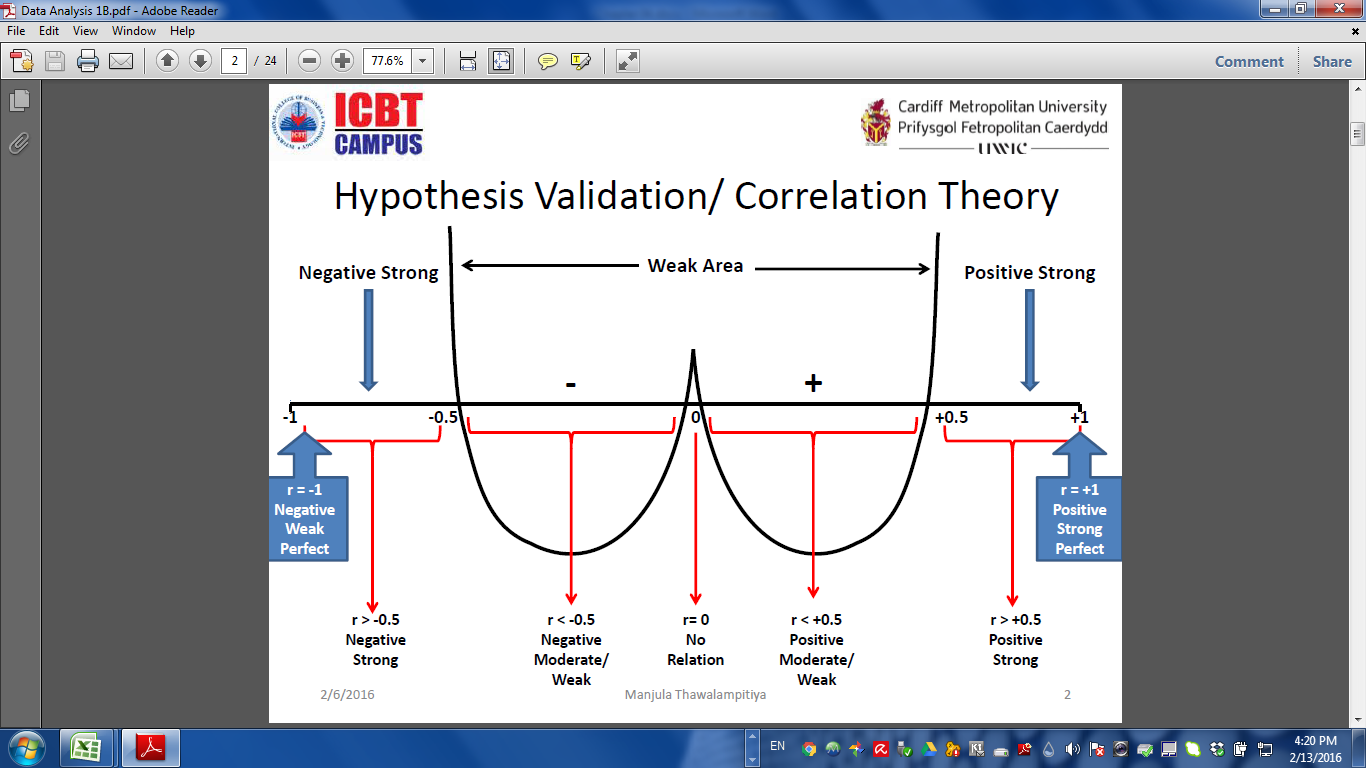
According to the Karl Person correlation theory, correlation coefficient (r) value implies the relationship between independent and dependent variables. Coefficient of determination r square (r2) value implies the variance of the dependent and independent variable. Also the p value implies the level of marginal significance of the hypothesis. At the 95% level of significance if the p value is less than 0.05 which explains there is a statistically significance between two variables.
Chapter Four – Data Presentation and Analysis
4.1 Internal consistency reliability measurement.
Ensure the reliability and internal consistency of the data is one of the main task before carry out the data analysis. According to the literature there are 3 main factors for data reliability those are reliability, test reliability and equivalent from reliability and internal consistency. In order to check the reliability and internal consistency there are serval models of identified by the previous studies. Those are Cronbach’s alpha, Guttmann model of reliability, Split-semi-reliability. For this research, the research selected the Cronbach’s alpha method as the model for test the reliability and the internal consistency.
Cronbach’s alpha method was developed by Lee Cronbach. According to this model internal consistency same concept needs to be carry out to all measurements. This needs to be determined before the test to be employed for research. If the study has multiple variables Cronbach’s alpha needs to be calculated for all the variables. Because reliability is needs to be tested for all variables.
Based on Cronbach’s explanation the values get from the Cronbach’s alpha value, internal consistency of the data classified. Below table shows the Cronbach’s alpha consistency indicator value range.
| Scale of the Cronbach’s Alpha | Classification for internal consistency |
| α≥ 0.9 | Excellent |
| 0.9 > α ≥ 0.8 | Good |
| 0.8 > α ≥ 0.7 | Acceptable |
| 0.7 > α ≥ 0.6 | Questionable |
| 0.6 > α ≥ 0.5 | Poor |
| α < 0.5 | Unacceptable |
Table 4.1: Consistency Indicator Cronbach’s Alpha
Source: Sekaran and Bougie (2013)
According to the Cronbach’s Alpha theory the researcher has tested the collected data using SPSS software to check the reliability and consistency. Which is given below.
| Variable | Cronbach’s alpha value | No of questions | Internal Consistency & reliability |
| Adopting of Innovation culture | 0.791 | 5 | Acceptable |
| Senior management involvement | 0.845 | 5 | Good |
| Training & knowledge development | 0.754 | 5 | Acceptable |
| Multi-disciplined team | 0.732 | 5 | Acceptable |
| Accepting risk | 0.832 | 5 | Good |
| Technology & resources | 0.829 | 5 | Good |
Table 4.2: Consistency measurement for collected data
Source: Research findings.
According to the Cronbach’s alpha value table all the collected data given α value > 0.7, therefore it can concludes that the collected data are acceptable to carry out the data analysis. So internal consistency reliability for the questionnaire was validated and individually all dependent and independent variables are validated.
Data presentation.
According to the defined sample for the research questionnaire was distributed among 112 employees coming under executive category, following is the given table for summary of collected data.
| Number of questionnaire distributed | 112 |
| Number of respondents | 105 |
| Number of missing respondents | 7 |
| Respondents number as percentage | 94% |
4.2 Data Analysis
Hypothesis test between Adoption of Innovation Culture (AIC) and Senior Management Involvement (SM).
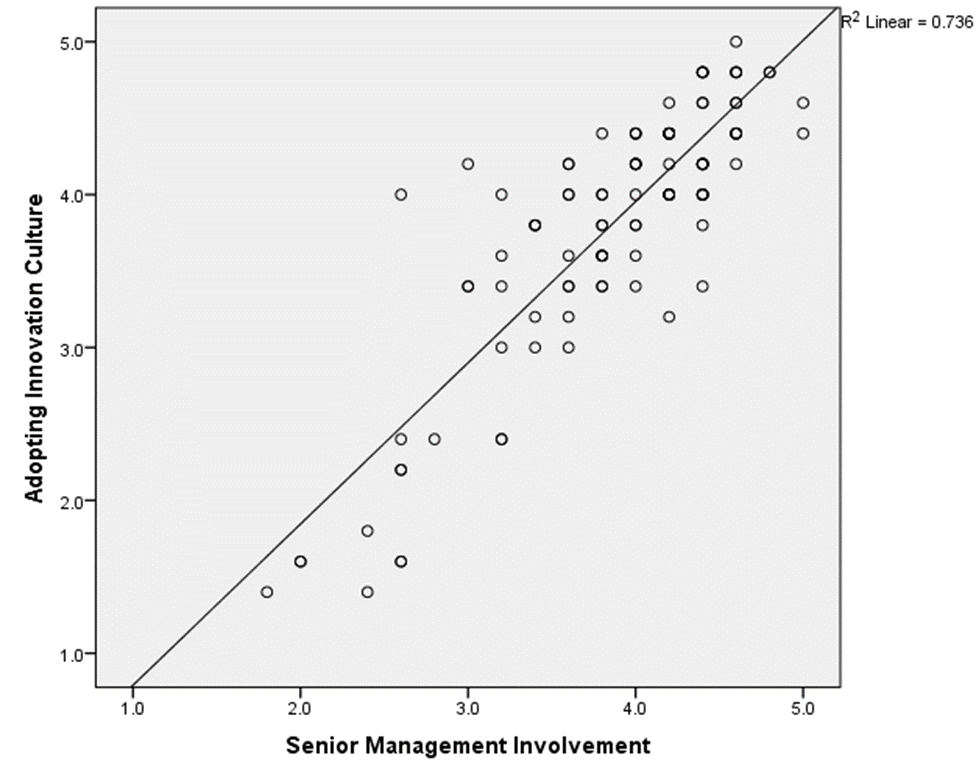 Scatter Plot: Adoption of Innovation culture and senior management involvement
Relationship Graph of AIC and SM
According to the above scatter plot, mean values of corresponding variables shows an uphill pattern which indicates there is a positive relationship between Adoption of Innovation Culture and Senior Management Involvement. As well as line of best fit on the scatter plot slopes upward from zero indicates there is a positive linear relationship between above two variables. That prove increases in Adoption of Innovation Culture involvement are correlated with increases of Senior Management Involvement.
Result of correlation coefficient for AIC & SM
| Model Summary | ||||
| Model | R | R Square | Adjusted R Square | Std. Error of the Estimate |
| 1 | .858a | .736 | .733 | .4401 |
| a. Predictors: (Constant), Senior Management Involvement | ||||
| ANOVAa | ||||||
| Model | Sum of Squares | df | Mean Square | F | Sig. | |
| 1 | Regression | 55.527 | 1 | 55.527 | 286.650 | .000b |
| Residual | 19.952 | 103 | .194 | |||
| Total | 75.480 | 104 | ||||
| a. Dependent Variable: Adopting Innovation Culture | ||||||
| b. Predictors: (Constant), Senior Management Involvement | ||||||
| Coefficientsa | ||||||
| Model | Unstandardized Coefficients | Standardized Coefficients | t | Sig. | ||
| B | Std. Error | Beta | ||||
| 1 | (Constant) | -.264 | .244 | -1.082 | .282 | |
| Senior Management Involvement | 1.055 | .062 | .858 | 16.931 | .000 | |
| a. Dependent Variable: Adopting Innovation Culture | ||||||
Summary of the output of AIC & SM.
| Correlation: AIC versus SM | |||
| Pearson correlation of AIC and SM = 0.858 | |||
| P- Value = 0.000 | |||
Correlation result of AIC and SM
| Regression Analysis: AIC versus SM | ||||
| Model | R | R Square | Adjusted R Square | Std. Error of the Estimate |
| 1 | .858 | 0.736 | 0.733 | 0.4401 |
Regression analysis result of AIC and SM
According to the result obtained using SPSS, R value represents the Pearson correlation value and is 0.858 which is close to 1. For this reason we can conclude that there is a strong positive relationship between Adoption of Innovation Culture and Senior Management Involvement. This means that changes in Adoption of Innovation Culture are strongly and positively correlated with the changes in Senior Management Involvement.
R-squire value of 0.736, indicates 73.6% of variance in the Adoption of the Innovation Culture can be predicted from the Senior Management Involvement.
When the corresponding P value for the model is compared to alpha level (α=0.05) P value for the corresponding data is less than alpha level (0.000<0.05) which indicate that the independent variable (Senior Management Involvement) reliably predicted the dependent variable (Adoption of Innovation Culture). Therefore, according to the P value (0.000) can conclude there is a statistically significant relationship between Senior Management Involvement and Adoption of Innovation Culture. Therefore the alternative hypotheses H11: There is a relationship between innovation culture and senior management involvement, is accepted while the null hypothesis H10: There is no relationship between innovation culture and senior management involvement, is rejected.
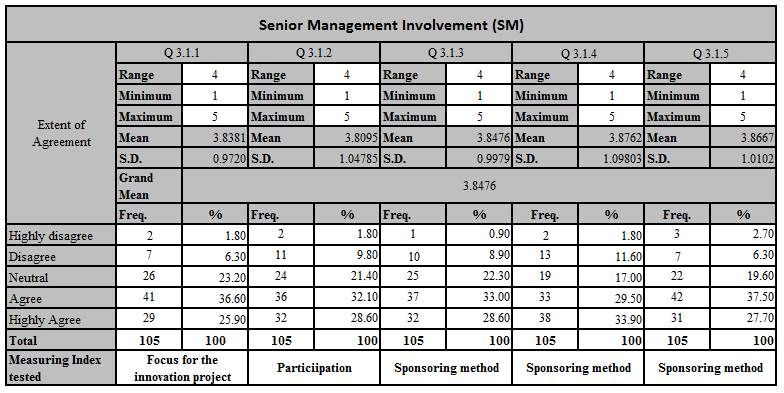
Further to above descriptive data analysis grand mean for the above five questions is 3.8476 which means majority of the responses in neutral to agree level.
Q 3.1.1 – The management is well focus on innovation projects. According to the above descriptive data mean value is 3.8381, that means majority of the respondents agree with the management focus on innovation project.
Q 3.1.2 – Management is actively participating to enhance innovation. Mean value of the tested question is 3.8095, which means management participation on enhance innovation also in agreed level.
Q 3.1.3 – Management should provide relevant knowledge and skill to do innovation. According to the above table mean value is 3.8476, which means management is providing enough skills to develop innovation.
Q 3.1.4 – Management encourage employees to work on innovation. Since the mean value is 3.8762 in this factor, management encourage to work on innovation project is also in satisfy level.
Q 3.1.5 – There is a dedicated time to involve innovation apart from routine work. Mean value of the selected factor is 3.8667, that mean respondents agrees with the dedicated time allocation for involve in innovation work.
Hypothesis test between Adoption of Innovation Culture (AIC) and Training and knowledge development (TD).
Scatter Plot: Adoption of Innovation culture and Training and knowledge development
Relationship Graph of AIC and TD
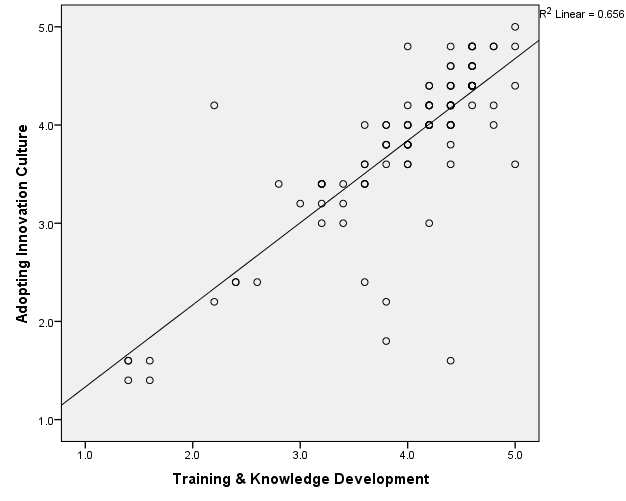
According to the above scatter plot, mean values of corresponding variables shows an uphill pattern which indicates there is a positive relationship between Adoption of Innovation Culture and Training & Knowledge Development. As well as line of best fit on the scatter plot slopes upward from zero indicates there is a positive linear relationship between above two variables. That prove increases in Adoption of Innovation Culture involvement are correlated with increases of Training & Knowledge Development.
Result of correlation coefficient for AIC & TD
| Model Summary | ||||
| Model | R | R Square | Adjusted R Square | Std. Error of the Estimate |
| 1 | .810a | .656 | .652 | .5024 |
| a. Predictors: (Constant), Training & Knowledge Development | ||||
| ANOVAa | ||||||
| Model | Sum of Squares | df | Mean Square | F | Sig. | |
| 1 | Regression | 49.482 | 1 | 49.482 | 196.040 | .000b |
| Residual | 25.998 | 103 | .252 | |||
| Total | 75.480 | 104 | ||||
| a. Dependent Variable: Adopting Innovation Culture | ||||||
| b. Predictors: (Constant), Training & Knowledge Development | ||||||
| Coefficientsa | ||||||
| Model | Unstandardized Coefficients | Standardized Coefficients | t | Sig. | ||
| B | Std. Error | Beta | ||||
| 1 | (Constant) | .497 | .241 | 2.065 | .041 | |
| Training & Knowledge Development | .836 | .060 | .810 | 14.001 | .000 | |
| a. Dependent Variable: Adopting Innovation Culture | ||||||
Summary of the output of AIC & TD.
| Correlation: AIC versus TD | |||
| Pearson correlation of AIC and TD = 0.810 | |||
| P- Value = 0.000 | |||
Correlation result of AIC and TD
| Regression Analysis: AIC versus TD | ||||
| Model | R | R Square | Adjusted R Square | Std. Error of the Estimate |
| 1 | .810a | 0.656 | 0.652 | 0.5024 |
Regression analysis result of AIC and TD
According to the result obtained using SPSS, R value represents the Pearson correlation value and is 0.810 which is close to 1. For this reason we can conclude that there is a strong positive relationship between Adoption of Innovation Culture and Training & Knowledge Development. This means that changes in Adoption of Innovation Culture are strongly and positively correlated with the changes in Training & Knowledge Development.
R-squire value of 0.656, indicates 65.6% of variance in the Adoption of the Innovation Culture can be predicted from the Training & Knowledge Development.
When the corresponding P value for the model is compared to alpha level (α=0.05) P value for the corresponding data is less than alpha level (0.000<0.05) which indicate that the independent variable (Training & Knowledge Development) reliably predicted the dependent variable (Adoption of Innovation Culture). Therefore, according to the P value (0.000) can conclude there is a statistically significant relationship between Training & Knowledge Development and Adoption of Innovation Culture. Therefore the alternative hypotheses H21: There is a relationship between innovation culture and training & knowledge development, is accepted while the null hypothesis H20: There is no relationship between innovation culture and training & knowledge development, is rejected.
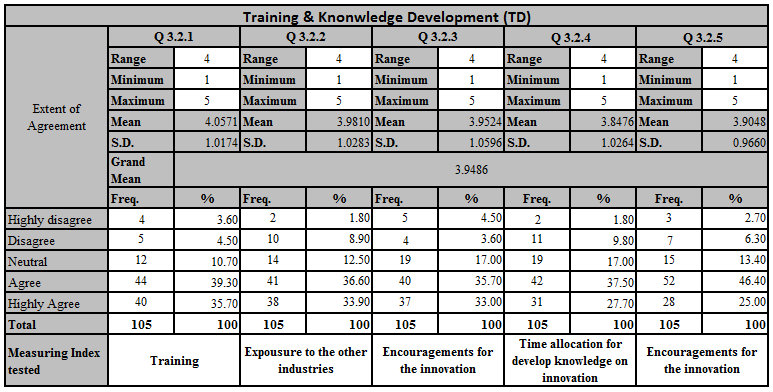
Further to above descriptive data analysis grand mean for the above five questions is 3.9486 which means majority of the responses close to the agree level.
Q 3.2.1 – Training & knowledge development is necessary to do innovation projects. Mean value of this sub factor is 4.0571, this means majority of respondents agrees that training & knowledge development necessary to do the innovation.
Q 3.2.2 – Other industry exposure is needed to do innovation projects. According to the descriptive table mean value is 3.9810, agrees that knowing about exposure to other industries.
Q 3.2.3 – Reward and recognition need to be focused on Innovation. Means value is equal to 3.9524 this means respondents of the selected sample agrees that trough recognition and rewarding effect innovation.
Q 3.2.4 – A specific time is allocated for knowledge development required for innovation. – Since the mean value is equal to 3.8476, time allocation for knowledge development is in agrees level.
Q 3.2.5 – Sharing current knowledge about related field among the workers. – Mean Value is equal to 3.9048, which is sharing current knowledge about the selected workers is important to create innovation culture.
Hypothesis test between Adoption of Innovation Culture (AIC) and Multi discipline team (MD).
Scatter Plot: Adoption of Innovation culture and Multi Discipline Team.
Relationship Graph of AIC and MD
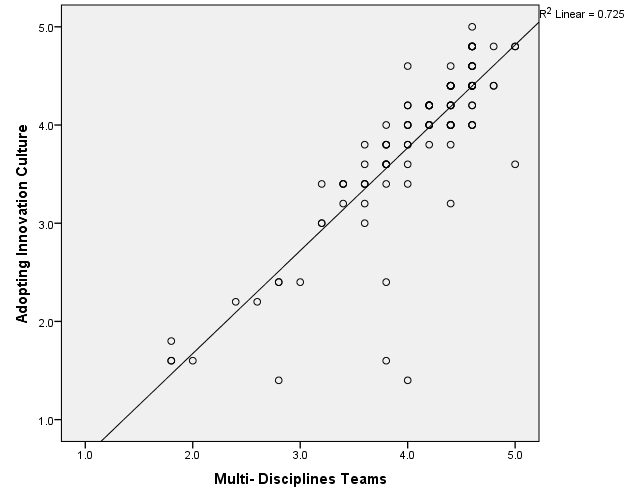
According to the above scatter plot, mean values of corresponding variables shows an uphill pattern which indicates there is a positive relationship between Adoption of Innovation Culture and Multi Discipline Teams. As well as line of best fit on the scatter plot slopes upward from zero indicates there is a positive linear relationship between above two variables. That prove increases in Adoption of Innovation Culture involvement are correlated with increases of Multi Discipline Teams.
Result of correlation coefficient for AIC & MD.
| Model Summary | ||||
| Model | R | R Square | Adjusted R Square | Std. Error of the Estimate |
| 1 | .852a | .725 | .722 | .4488 |
| a. Predictors: (Constant), Multi- Disciplines Teams | ||||
| ANOVAa | ||||||
| Model | Sum of Squares | df | Mean Square | F | Sig. | |
| 1 | Regression | 54.730 | 1 | 54.730 | 271.675 | .000b |
| Residual | 20.750 | 103 | .201 | |||
| Total | 75.480 | 104 | ||||
| a. Dependent Variable: Adopting Innovation Culture | ||||||
| b. Predictors: (Constant), Multi- Disciplines Teams | ||||||
| Coefficientsa | ||||||
| Model | Unstandardized Coefficients | Standardized Coefficients | t | Sig. | ||
| B | Std. Error | Beta | ||||
| 1 | (Constant) | -.422 | .260 | -1.625 | .107 | |
| Multi- Disciplines Teams | 1.048 | .064 | .852 | 16.483 | .000 | |
| a. Dependent Variable: Adopting Innovation Culture | ||||||
Summary of the output of AIC & MD.
| Correlation: AIC versus MD | |||
| Pearson correlation of AIC and MD = 0.852 | |||
| P- Value = 0.000 | |||
Correlation result of AIC and MD
| Regression Analysis: AIC versus MD | ||||
| Model | R | R Square | Adjusted R Square | Std. Error of the Estimate |
| 1 | .852a | 0.725 | 0.722 | 0.4488 |
Regression analysis result of AIC and MD
According to the result obtained using SPSS, R value represents the Pearson correlation value and is 0.852 which is close to 1. For this reason we can conclude that there is a strong positive relationship between Adoption of Innovation Culture and Multi Discipline Team. This means that changes in Adoption of Innovation Culture are strongly and positively correlated with the changes in Multi Discipline Team.
R-squire value of 0.725, indicates 72.5% of variance in the Adoption of the Innovation Culture can be predicted from the Multi Discipline Team.
When the corresponding P value for the model is compared to alpha level (α=0.05) P value for the corresponding data is less than alpha level (0.000<0.05) which indicate that the independent variable (Multi Discipline Team.) reliably predicted the dependent variable (Adoption of Innovation Culture). Therefore, according to the P value (0.000) can conclude there is a statistically significant relationship between Multi Discipline Team. and Adoption of Innovation Culture. Therefore the alternative hypotheses H31: There is a relationship between innovation culture and training & multi discipline team. Is accepted while the null hypothesis H30: There is no relationship between innovation culture and multi discipline team. Is rejected.
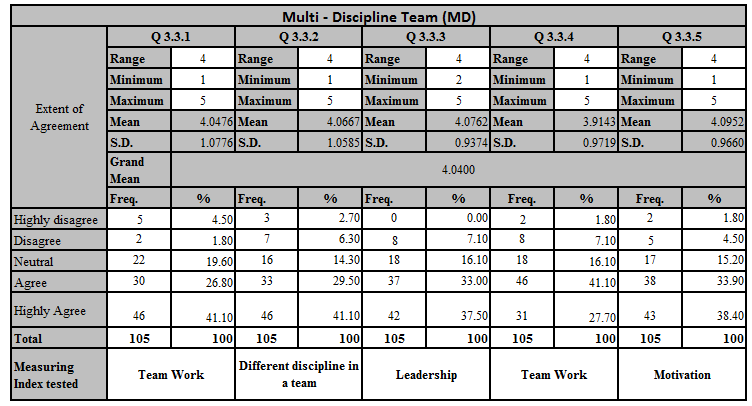
According to the above descriptive data analysis grand mean for the above five questions is 4.0400 which means majority of the responses close to the agree level.
Q 3.3.1 – Team working is easy to have innovation – Mean value of this sub factor is 4.0476 which means majority has agrees that working in a team environment is easy to do innovation.
Q 3.3.2 – Team members from various disciplines will help for innovation – According to the above table mean value is equal to 4.0667, which means various disciple also helps to create culture.
Q 3.3.3 – Good leadership for the team is needed to have better results – Mean value of this factor is 4.0762, which implies innovation culture requires a team with a good leadership. Which helps to guide the team for new thinking.
Q 3.3.4 – Work load spread among the team member will help to have good innovation – Innovation culture needs free minds with less stress. When the workload divide among the members of the team will helps to innovation culture which is confirm from the mean equal to 3.9143.
Q 3.3.5 – Team motivation help for the innovation – Mean value is 4.0952 which is motivation also have positive for creating innovation culture.
Hypothesis test between Adoption of Innovation Culture (AIC) and Accepting Risk (AR).
Scatter Plot: Adoption of Innovation culture and Accepting Risk.
 Relationship Graph of AIC and AR
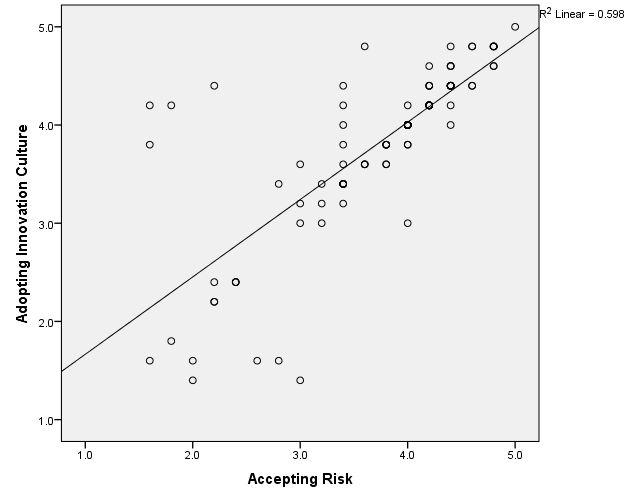
According to the above scatter plot, mean values of corresponding variables shows an uphill pattern which indicates there is a positive relationship between Adoption of Innovation Culture and Accepting Risk. As well as line of best fit on the scatter plot slopes upward from zero indicates there is a positive linear relationship between above two variables. That prove increases in Adoption of Innovation Culture involvement are correlated with increases of Accepting Risk.
Result of correlation coefficient for AIC & AR.
| Model Summary | ||||
| Model | R | R Square | Adjusted R Square | Std. Error of the Estimate |
| 1 | .773a | .598 | .594 | .5427 |
| a. Predictors: (Constant), Accepting Risk | ||||
| ANOVAa | ||||||
| Model | Sum of Squares | df | Mean Square | F | Sig. | |
| 1 | Regression | 45.149 | 1 | 45.149 | 153.318 | .000b |
| Residual | 30.331 | 103 | .294 | |||
| Total | 75.480 | 104 | ||||
| a. Dependent Variable: Adopting Innovation Culture | ||||||
| b. Predictors: (Constant), Accepting Risk | ||||||
| Coefficientsa | ||||||
| Model | Unstandardized Coefficients | Standardized Coefficients | t | Sig. | ||
| B | Std. Error | Beta | ||||
| 1 | (Constant) | .878 | .242 | 3.630 | .000 | |
| Accepting Risk | .788 | .064 | .773 | 12.382 | .000 | |
| a. Dependent Variable: Adopting Innovation Culture | ||||||
Summary of the output of AIC & AR
| Correlation: AIC versus AR | |||
| Pearson correlation of AIC and AR = 0.773 | |||
| P- Value = 0.000 | |||
Correlation result of AIC and AR
| Regression Analysis: AIC versus AR | ||||
| Model | R | R Square | Adjusted R Square | Std. Error of the Estimate |
| 1 | .773a | 0.598 | 0.594 | 0.5427 |
Regression analysis result of AIC and AR
According to the result obtained using SPSS, R value represents the Pearson correlation value and is 0.773 which is close to 1. For this reason we can conclude that there is a strong positive relationship between Adoption of Innovation Culture and Accepting Risk. This means that changes in Adoption of Innovation Culture are strongly and positively correlated with the changes in Accepting Risk.
R-squire value of 0.598, indicates 59.8% of variance in the Adoption of the Innovation Culture can be predicted from the Accepting Risk.
When the corresponding P value for the model is compared to alpha level (α=0.05) P value for the corresponding data is less than alpha level (0.000<0.05) which indicate that the independent variable (Accepting Risk) reliably predicted the dependent variable (Adoption of Innovation Culture). Therefore, according to the P value (0.000) can conclude there is a statistically significant relationship between Accepting Risk. And Adoption of Innovation Culture. Therefore the alternative hypotheses H41: There is a relationship between innovation culture and Accepting Risk. Is accepted while the null hypothesis H40: There is no relationship between innovation culture and Accepting Risk. Is rejected.
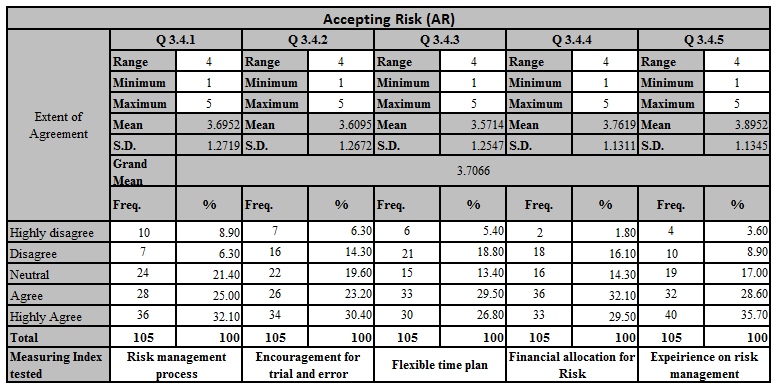
According to the above descriptive data analysis grand mean for the above five questions is 3.7066 which means majority of the responses close to the agree level.
Q 3.4.1 – Risk management process should be placed to innovation projects – Mean value for this sub factor is equal to 3.6952, which means innovation culture requires a risk management process on innovation projects.
Q 3.4.2 – Management accept failures – According to the above descriptive analysis men value is equal to 3.6095, that mean respondents are in a middle of neutral to agree level, which means management needs to accept failure on projects.
Q 3.4.3 – Flexible time plan is given when doing an innovation projects – Mean value is equal to 3.5714, that implies the flexible time plan on innovation project is acceptable but need to be improve.
Q 3.4.4 – Adequate financial provision are made to cover contingencies. – Mean value is equal to 3.7619, which denotes that financial allocation for risk on failures is in acceptable level.
Q 3.4.5 – Risk analysis are done by expert team. – In this factor mean value is equal to 3.8952, which means majority of innovation projects are analyze by an expert team.
Hypothesis test between Adoption of Innovation Culture (AIC) and Technology and Resources (TR).
Scatter Plot: Adoption of Innovation culture and Technology and Resources (TR).
Relationship Graph of AIC and TR
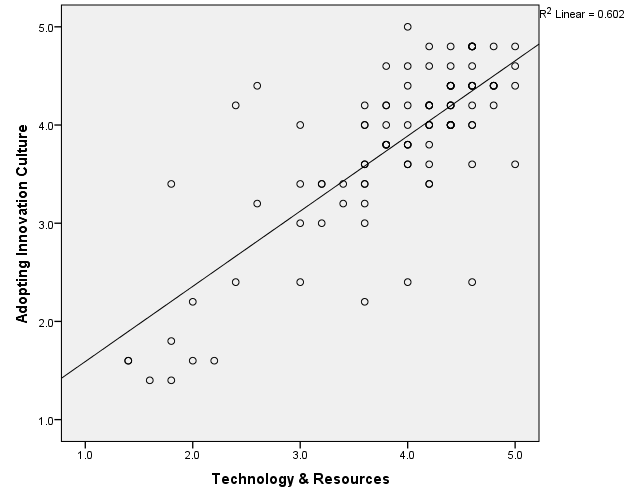
According to the above scatter plot, mean values of corresponding variables shows an uphill pattern which indicates there is a positive relationship between Adoption of Innovation Culture and Technology and Resources. As well as line of best fit on the scatter plot slopes upward from zero indicates there is a positive linear relationship between above two variables. That prove increases in Adoption of Innovation Culture involvement are correlated with increases of technology and resources.
Result of correlation coefficient for AIC & TR.
| Model Summary | ||||
| Model | R | R Square | Adjusted R Square | Std. Error of the Estimate |
| 1 | .776a | .602 | .598 | .5401 |
| a. Predictors: (Constant), Technology & Resources | ||||
| ANOVAa | ||||||
| Model | Sum of Squares | df | Mean Square | F | Sig. | |
| 1 | Regression | 45.432 | 1 | 45.432 | 155.739 | .000b |
| Residual | 30.047 | 103 | .292 | |||
| Total | 75.480 | 104 | ||||
| a. Dependent Variable: Adopting Innovation Culture | ||||||
| b. Predictors: (Constant), Technology & Resources | ||||||
| Coefficientsa | ||||||
| Model | Unstandardized Coefficients | Standardized Coefficients | t | Sig. | ||
| B | Std. Error | Beta | ||||
| 1 | (Constant) | .826 | .244 | 3.385 | .001 | |
| Technology & Resources | .766 | .061 | .776 | 12.480 | .000 | |
| a. Dependent Variable: Adopting Innovation Culture | ||||||
Summary of the output of AIC & TR
| Correlation: AIC versus TR | |||
| Pearson correlation of AIC and AR = 0.776 | |||
| P- Value = 0.000 | |||
Correlation result of AIC and TR
| Regression Analysis: AIC versus TR | ||||
| Model | R | R Square | Adjusted R Square | Std. Error of the Estimate |
| 1 | .776a | 0.602 | 0.598 | 0.5401 |
Regression analysis result of AIC and TR
According to the result obtained using SPSS, R value represents the Pearson correlation value and is 0.776 which is close to 1. For this reason we can conclude that there is a strong positive relationship between Adoption of Innovation Culture and Technology & Resources. This means that changes in Adoption of Innovation Culture are strongly and positively correlated with the changes in Technology & Resources.
R-squire value of 0.602, indicates 60.2% of variance in the Adoption of the Innovation Culture can be predicted from the Technology & Resources.
When the corresponding P value for the model is compared to alpha level (α=0.05) P value for the corresponding data is less than alpha level (0.000<0.05) which indicate that the independent variable (Technology & Resources) reliably predicted the dependent variable (Adoption of Innovation Culture). Therefore, according to the P value (0.000) can conclude there is a statistically significant relationship between Technology & Resources. And Adoption of Innovation Culture. Therefore the alternative hypotheses H51: There is a relationship between innovation culture and technology & resources. Is accepted while the null hypothesis H50: There is no relationship between innovation culture and technology & resources. Is rejected.
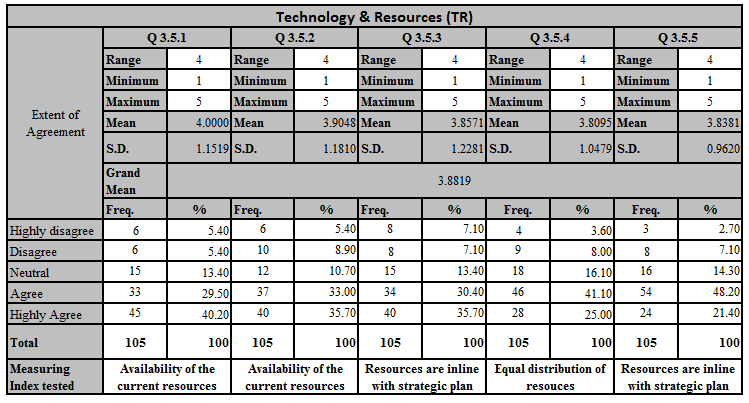
According to the above descriptive data analysis grand mean for the above five questions is 3.8819 which means majority of the responses close to the agree level.
Q 3.5.1 – Current technology & resources are enough to drive current operation. – According to the descriptive analysis mean value is 4.0, which means respondents agrees that current resources in an Agree level.
Q 3.5.2 – Internal technology & resources. Are in line with the Industry excellence resources – Mean value is equal to 3.9048, that implies current availability of the resources are in a satisfy level.
Q 3.5.3 – Enough technology and resources are available to produce innovative ideas. – Mean value is 3.8571, which means there are enough resources in line with innovative culture.
Q 3.5.4 – Adequate accessibility is provided for current technology and resources among employees. Mean value is equal to 3.8095.
Q 3.5.5 – Adequate provision are available for continuous improvement of technology and resources. According to the descriptive analysis mean value is equal to 3.8381.
Chapter Five – Conclusions and Recommendation
5.1 Summary of the study
The objective of the research is to explore and determine the factors that contribute for the adoption of an innovation culture at H F PLC. Innovation is a new word in the H fabric vocabulary because this was introduced in year 2013/14. In this study the researcher founds that innovation has become key success factor to any industry especially in the appeal industry. Because current product ranges become to the maturity level. The researcher carry out a survey by using close ended questions to find out the factors which are influence to adopt the innovation culture at Ha F PLC. Innovation is only in the growth stage at H F PLC the company is still finds hard situation when expanding innovation strategies among the total employees. However this study is carryout among 112 employees falls under executive category to senior manager level. Main intend to select this as the total population for this research is those are the people who currently involve in innovation projects at the company and actively participate towards achieve strategic goals.
Based on the five factors considered in the conceptual framework and data were collected according to the prepared questionnaire. After gathered all collected data, researcher has analyzed the data by using SPSS statistical analytical software and also used Excel 2010 for presenting and gathered data.
Gathered data were tested according to the Cronbach’s Alpha method. Which indicates the internal consistency reliability of the collected data. Based on the reliability results of the data all collected data indicates “Acceptable” & “Good”, which means all the data are internal consistency reliable. Further in chapter 4 presented the significance of the relationship of dependent variable and independent variables. “Pearson Correlation Coefficient” & P- value tested on 95% confidence level and further describes according to the regression analysis and descriptive statistical analysis.
According to the Pearson Correlation Coefficient relationship, all the five variables has a strong positive relationship with the dependent variable (Adoption of innovation culture). Also P-value tested at 95% confidence level to the all five independent variables and based on the results all five independent variables are statistically significant with dependent variable. Summary of the chapter 4, data analysis is given in the below table.
| Variable tested | Cronbach’s Alpha Value | Pearson Correlation Coefficient Relationship Interpretation | Significance (p value) | Contribution to the variance of Dependent Variable | Hypothesis Accepted | Mean Value |
| SM | Good | Very Strong Positive (0.858) | Significant (P=0.000) | 73.6% | H11 | 3.8476 |
| TD | Acceptable | Very Strong Positive (0.810) | Significant (P=0.000) | 65.6% | H21 | 3.9486 |
| MD | Acceptable | Very Strong Positive (0.852) | Significant (P=0.000) | 72.5% | H31 | 4.0400 |
| AR | Good | Very Strong Positive (0.773) | Significant (P=0.000) | 59.8% | H41 | 3.7066 |
| TR | Good | Very Strong Positive (0.776) | Significant (P=0.000) | 60.2% | H51 | 3.8819 |
Table 5.1: Summary of data analysis results
Source: Survey data analysis results
5.2 Conclusion of the Study
The researcher findings are discussed in the above summary of the study. Which indicates that all five independent variables have positive relationship with the dependent variable (Adoption of innovation culture). Based on the
The researcher findings discussed above, indicates that all five factors have strong positive relationship with the “Adoption of Innovation Culture” based on the research hypothesis developed during the study. And the researcher’s main objectives of understanding factors that influence adoption of innovation culture at H F PLC. To examined and analysis the how relationship impact those factors towards adopting innovation culture in similar industries.
Based on the descriptive statistics result of mean value of 3.7981 resulted for adoption of innovation culture being value places between neutral to agree level, it indicates that innovation is placed to an agreed level with executive and above employees.
Further the data analysis results for hypothesis developed for the selected dependent and independent variables are as discussed below.

2 comments