
Executive Summary
The Manufacturing Plant selected was the in Rathmalana, where wet processing and finishing services are offered to all Brax garments. Their operations process was analyzed from the point of receiving garments, sorting, and the wet process which included sampling, dying, washing, drying and quality control, special effects where needed ,quality assurance and dispatching back to the relevant plants again.
Being a world renowned company the management was not very forthcoming in discussing and providing statistical data on the weaknesses in their operating process, thus limiting the scope to could explore and come up with solutions.
However, some major issues that hinder their productivity were identified. The issue identified was the high rate of absenteeism and labor turn over. (3 out of 10 new recruits left the plant within a month of recruitment)Collected information on this issue helped to identify the reasons that contributed towards this situation as well as enabling to come up with solutions to overcome this problem and help the company to increase their productivity. In this report a thorough analysis of the situation is included using all the theoretical information attained and also few solutions have been suggested to help Brax solve their problem of reduced productivity.
After analyzing all the facts, the conclusion was that the Management of Brax Finishing Plant should pay much closer attention to the employee needs and take steps to fulfill them. If dealt with correctly, the problem of high employee turnover can be solved in a manner that is both beneficial to the company as well as the employees, ultimately resulting in profits to the company.
Introduction to the organization
Brax Finishing Plant located in Galle Road, Rathmalana is a large scale plant that provides dying and other finishing processes to garments produced by The Brax Group of Companies as well as a few outside customers. There are approximately 400 line employees employed by the plant as well as approximately 50 administrative staff. They have applied many of the proven theoretical management concepts into practical use and have been highly successful in gaining the maximum benefits off them.
Brax Finishing provides Group-wide wet processing and finishing services that is integral to the inspired and vertically integrated solutions offered by Brax . These propositions are also offered to a limited number of external customers locally. An all-inclusive Research and Development unit works in close co-operation with customers and achieves results that take finishing to beyond mere processing.
Brax Finishing recently received the GOTS organic certification which enables Brax to provide organic textiles, organic manufacture and organic washing as a comprehensive service. This Group-wide initiative will create a fully-integrated, organic-certified supply chain, producing only organic apparel.
Transformed from a basic wash plant into one of the world’s leading washing, dyeing and finishing facilities, it affects washes encompassing enzyme, stone and rubber ball washes. Other finishes include tinting, tie-and- dye and dip-dyes using sulphur and pigment dye-stuff; and special finishes such as sandblasting, whiskering, permanent creasing and laser blasting. The latter finish is executed at its laser facility which is the largest in Asia.
The company was recently awarded the Gold Award by the prestigious International Green Apple Environmental Awards for its innovative achievement of zero disposals of solid waste and sludge to landfill, by converting its effluent to environmentally, economically and socially relevant by products. These include bio gas, organic fertilizer and solid bricks used to construct a vocational training centre for the differently-able.
Background of the problem
Most businesses exist for the primary purpose of earning profit. Earning profit requires maximizing sales and minimizing costs. Productivity involves getting as much as possible accomplished in as little resources as possible. This increases sales by enabling the company, to have more products available, and it reduces costs by lessening the payroll.
Because of the high turnover there will always be a of lack of employees at any given time which will keep the plant from achieving its maximum production capacity, which in turn reduces the productivity of the plant. This is a waste of limited resources and could result in possible losses to Brax .
The cost that has to be incurred to replace the employees who leave is another waste of the resources of Brax that could have been invested elsewhere to generate more profits for the company.
There is also the fact that the high turnover always leaves the plant shorthanded with staff at all times. Therefore, the remaining staff have to put in extra effort to achieve the given productivity targets. This will increase the workload of each individual employee exposing them to unnecessary health problems and stress. This could again result in contributing to the already high labor turnover. And since the workers will only be concentrating on achieving their productivity targets they might not pay much attention to the quality of products, thus resulting in a high rate of defects.
This issue can also be damaging to the image of the company, especially since Brax is a company with a high reputation. This could result in possible loss of customers who are ethically concerned.(e.g. :- European union customers who are very particular about garments without guilt)This could also result adversely to the company when recruiting new employees since the more qualified workers will not be interested in applying due to the poor reputation.
Collection of Primary Data
Primary data is original research that is obtained through first-hand investigation, while secondary data is research that is widely available and obtained from another party. Primary data includes information collected from interviews, experiments, surveys, questionnaires, focus groups and measurements.To collect the primary data required to resolve this problem it is propose to use a questionnaire that can be distributed among the employees to collect data on what are the reasons for the high labour turnover and absenteeism. The data needs to be collected on an anonymous basis in order to gather more trustworthy information since the employees will be more forth coming if they were sure they can on be identified and penalized by their management for pointing out weaknesses.
- Please refer Annexure I for the questionnaire
Collection of Secondary data
Secondary data is usually immediately available to the public at little or no cost. It can also be used for extended lengths of time. For example, looking at a company’s income rates over a 10-year period can provide insight into trends that may not be obtainable from primary data. The downside to secondary data is that it is generally focused on broader topics and may be out of date.
For this case scenario it is recommended to use the secondary data from company’s past annual reports, data published by similar companies (MAS),etc.
Survey Methodology and Sampling Frame
Survey Methodology
Since the project focuses on the blue collar labour working in the plant it is advisable to collect data through a verbal approach rather than conducting a survey through written means, given the assumption that the literacy level of such labourers tends to be at a minimum level.
It is preferred that the research team members meet these workers in face to face interviews. Considering the given resources a number of research team members can be assigned to each estate to carry out this process.
Each team member is advised to carry a list of relevant guideline questions that they can utilize in interviewing the workers in order to maintain the uniformity in the data collected by each team member. (Please refer Annexure I for a draft of the guideline question sheet)
These questions will need to be simple and short, easy to be understood. It can be a combination of Yes or No and Short answer questions that will help in gathering quantitative information with a few open ended questions which will help the researchers in gathering qualitative information.
Before gathering information from any of the respondents they will have to be explained about the purpose of the study as well as their consent will have to be obtained. The employees will have to be specifically assured none of the data they provide will be traced back to them by their employers, and the confidentiality of the data gathered will have to be assured to all parties involved.
The quantitative data gathered can be analyzed using data analyzing tools such as excel, SPSS etc, while re listening to interviews will help with analyzing the qualitative data gathered.
Sampling Frame
Since the factory plant employees closer to 400 labours on shift basis it is proposed to use 100 employees which represents 25% of the total labour population of the plant. They need to be selected on a random basis, while making sure that employees representing both shifts are represented in the sample.
Analysis of the collected data
Basic Data
- Sample Size – 100 employess
- Data Collection Method – questionnaire
Gender Composition
Shift Time representation
Service Period
Absent Days
Previous Experience in similar capacity of the employees
Involvement of machinery in work
Previous Experience/Knowledge of the machine operated by the employee
Learning Method on how to operate the machines
Satisfaction Based on Salary
Satisfaction based of Shift Time
Satisfaction about Sanitary Facilities
Satisfaction based of working Environment
Factors of Dissatisfaction in the Working Environment
Future plans to stay with the company
Conclusions from analysis of the Information Gathered
Detailed Analysis of Causes of High Labor Turnover
Problems in the Working Environment
Since the company engages in drying and washing the garments they received, they have to operate number of machines within the organization. These machines consume a huge amount of dangerous chemicals. But due to the heat generated by those machines operators find it very uncomfortable to wear the safety uniforms. Although we were not informed of any actual accidents that occurred, it was obvious that this was a threat to the health and safety of the employees. The heat emanating from the machines, itself was unbearable .From what we gathered this was mainly due to the fact that many large machines, which produced a lot of heat were crammed together in a very limited space. The Ultimate result is long lasting health problems which are as caused by chemicals. The unfriendly working environment forces employees to give up on their jobs.
Issues in Management
Not providing proper training or having a proper induction process in place has lead to the hindering of the employees’ maximum potential efficiency as well as increasing the possibility of damages and defects.
The management’s lack of concern about the employees’ welfare is shown by not taking steps to change the tiring working schedules which are unbearable to most of the employees.
This has also directly lead to the high labor turn over to the point, that out of every 10 employees recruited 3 would leave the plant within the first month of recruitment, bringing the labor turnover of the company to a very high number.
The management not considering employee suggestions into consideration is another factor that has caused employee dissatisfaction.
Other factors
The tiring working schedules of the 12 hour shift, especially when they have to work with heavy machinery in an overheated building is a major cause that has contributed to the high turnover of the employees. This schedule is harmful to the physical and the psychological well being of employees in the long term.
The high rate of attendance allowance de-motivates the employees rather than encourage them to attend work due to the fact that a significant amount will be deducted off their salary, even for a day’s absence, even if there is a completely justifiable reason. This penalty has actually acted as a major in cause to reducing the appeal of the job.
Another fact that has lead to the high labor turnover is the lack of carrier development opportunities in this line of work.
Problems With Employees
The company hires unskilled labor. This would not have resulted in a problem if they were given proper training and an induction to the company and work when they joined the factory. However, since that has been ignored by the management the employees are neither equipped with proper knowledge to neither handle all the sophisticated machinery, nor do they have a clear idea about the organization culture.
All the above mentioned reasons ; management issues, working environment and other factors have ultimately resulted in dissatisfaction of employees leading to the high rate of absenteeism as well as a employee turnover.
Use of measures of Dispersion
Dispersion is useful to find the relation between the set of data. Actually, there are two measures of dispersion. First is standard deviation and second is variance
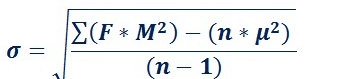
Standard Deviation
The standard deviation of a sample is known as S and is calculated using: Where x represents each value in the population, x is the mean value of the sample, Σ is the summation (or total), and n-1 is the number of values in the sample minus 1.
The formula for the standard deviation dispersion are as follows:
Variation
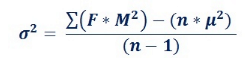
The variance (σ2) is a measure of how far each value in the data set is from the mean.
The variance measures how far each number in the set is from the mean. Varianceis calculated by taking the differences between each number in the set and the mean, squaring the differences (to make them positive) and dividing the sum of the squares by the number of values in the set.
The formula for the variance (σ2) dispersion are as follows
Employee Absenteeism
According to the dispersion calculations the conclusion can be made that each month any given employees out of the sample population will be absent for 4.45 days from work.
Most businesses exist for the primary purpose of earning profit. Earning profit requires maximizing sales and minimizing costs. Productivity involves getting as much as possible accomplished in as little resources as possible. This increases sales by enabling the company, to have more products available, and it reduces costs by lessening the payroll.
Because of the high turnover there will always be a of lack of employees at any given time which will keep the plant from achieving its maximum production capacity, which in turn reduces the productivity of the plant. This is a waste of limited resources and could result in possible losses to Brax.
Quartiles, percentiles and the correlation coefficient
According to Anderson et al (2012), quartile use to separate data in two quarters. Percentiles are where the observed data are similar or larger than the percentile figure. The correlation coefficient is the tool that uses to interpret the linear relationship between two variables.
Quartiles
The first quartile (also called the lower quartile) is the number below which lies the 25 percent of the bottom data. The second quartile (the median) divides the range in the middle and has 50 percent of the data below it. The third quartile (also called the upper quartile) has 75 percent of the data below it and the top 25 percent of the data above it
Analyzing variability using quartile summary statistics may play an important role in benchmarking. For example, we can seek to understand if there are large differences in processing times for a particular step, and then gain an insight into what accounts for the differences. Is the task duration affected by having more experienced operators, different levels of knowledge, or better practices?
Quartiles represent the value for which 25% of the data is below (Q1) and the value for which 25% of the data is above (Q3). The Interquartile Range (IQR) is the difference between these two quartiles (Q3 – Q1 = IQR). A major advantage of using the Interquartile Range (IQR) to estimate variability is that it is much less sensitive to outliers than the variance or the Standard Deviation summary statistics.
Number (value) that represents a percentage position in a list (range) of data. For example, if the performance of an entity is at 43rd percentile, then it performs better than 43 percent of all entities within its group
Percentiles
Percentiles report the relative standing of a particular value within a statistical data set. If that’s what you’re most interested in, the actual mean and standard deviation of the data set are not important, and neither is the actual data value. What’s important is where you stand — not in relation to the mean, but in relation to everyone else:
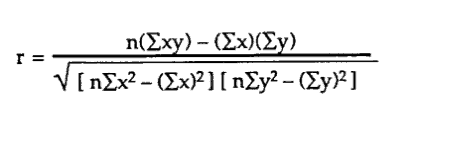
Correlation Coefficiency
The correlation coefficient is a measure that determines the degree to which two variables’ movements are associated. The range of values for the correlation coefficient is -1.0 to 1.0. If a calculated correlation is greater than 1.0 or less than -1.0, a mistake has been made. A correlation of -1.0 indicates a perfect negative correlation, while a correlation of 1.0 indicates a perfect positive correlation.
While the correlation coefficient measures a degree to which two variables are related, it only measures the linear relationship between the variables. Nonlinear relationships between two variables cannot be captured or expressed by the correlation coefficient.
A value of exactly 1.0 means there is a perfect positive relationship between the two variables. For a positive increase in one variable, there is also a positive increase in the second variable. A value of exactly -1.0 means there is a perfect negative relationship between the two variables. This shows the variables move in opposite directions; for a positive increase in one variable, there is a decrease in the second variable. If the correlation is 0, this simply means there is no relationship between the two variables. The strength of the relationship varies in degree based on the value of the correlation coefficient. For example, a value of 0.2 indicates there is a positive relationship between the two variables, but it is weak.
This type of statistic is useful in many ways in finance. For example, it can be helpful in determining how well a mutual fund is behaving compared to its benchmark index, or it can be used to determine how a mutual behaves in relation to another fund or asset class. By adding a low or negatively correlated mutual fund to an existing portfolio, diversification benefits are gained.
If the scatter plot doesn’t indicate there’s at least somewhat of a linear relationship, the correlation doesn’t mean much. Why measure the amount of linear relationship if there isn’t enough of one to speak of? However, you can take the idea of no linear relationship two ways:
1) If no relationship at all exists, calculating the correlation doesn’t make sense because correlation only applies to linear relationships; and
2) If a strong relationship exists but it’s not linear, the correlation may be misleading, because in some cases a strong curved relationship exists. That’s why it’s critical to examine the scatter plot first.
Correlation Coefficiency
Calculating Correlation Coefficiency
| Time | 17 | 39 | 11 | 26 | 18 | 32 | 17 | 29 | 23 | 31 | 29 | 13 | 30 | 14 | 33 |
| Marks | 49 | 77 | 47 | 64 | 67 | 72 | 71 | 74 | 66 | 81 | 59 | 47 | 73 | 47 | 73 |
| Time | 29 | 16 | 23 | 39 | 33 | 17 | 26 | 15 | 30 | 35 | 16 | 16 | 21 | 14 | 22 |
| Marks | 75 | 56 | 60 | 62 | 63 | 54 | 54 | 53 | 46 | 94 | 65 | 50 | 68 | 35 | 63 |
| Time | 19 | 24 | 20 | 20 | 28 | 38 | 27 | 11 | 39 | 18 | 29 | 13 | 24 | 38 | 27 |
| Marks | 56 | 82 | 77 | 73 | 70 | 34 | 72 | 76 | 50 | 71 | 46 | 56 | 63 | 74 | 63 |
| Time | 18 | 38 | 23 | 34 | 34 | 11 | 29 | 33 | 16 | 23 | 20 | 10 | 32 | 38 | 28 |
| Marks | 57 | 64 | 53 | 47 | 62 | 83 | 57 | 45 | 83 | 63 | 60 | 41 | 54 | 75 | 61 |
A)
Correlation Coefficiency of Time and Marks
Correlation Coefficiency = 0.16
Least Square Line
Least Square Line = y = 54.475 + 0.342⋅x
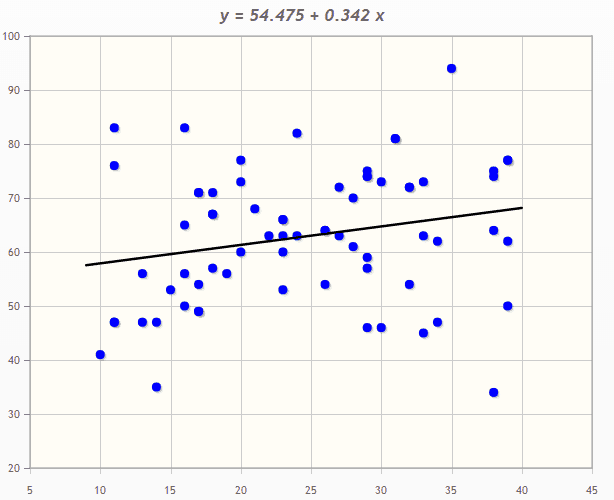
B) Relationship between marks and study
In statistics, the correlation coefficient r measures the strength and direction of a linear relationship between two variables on a scatter plot. The value of r is always between +1 and –1. To interpret its value, see which of the following values your correlation r is closest to:
Exactly –1. A perfect downhill (negative) linear relationship
–0.70. A strong downhill (negative) linear relationship
–0.50. A moderate downhill (negative) relationship
–0.30. A weak downhill (negative) linear relationship
0. No linear relationship
+0.30. A weak uphill (positive) linear relationship
+0.50. A moderate uphill (positive) relationship
+0.70. A strong uphill (positive) linear relationship
Exactly +1. A perfect uphill (positive) linear relationship
The correlation analysis suggests that with a positive corelationship of 0.16 the time spent on studying and the marks of the students show a weak positive/uphill linear relationship.
Network Diagram
| Task | Description | Depend on… | Time (Weeks) |
| A | High level analysis | None | 1 |
| B | Selection of hardware platform | None | 1 |
| C | Installation and commissioning of hardware | A,B | 2 |
| D | Detailed analysis of core modules | A | 2 |
| E | Detailed analysis of supporting modules | B | 2 |
| F | Programming of core modules | C,D,E | 2 |
| G | Programming of supporting modules | F | 3 |
| H | Quality assurance of core modules | F | 1 |
| I | Quality assurance of supporting modules | F | 1 |
| J | Core module training | H,I | 1 |
| K | Development and QA of accounting reporting | J | 1 |
| L | Complete the project | K | 1 |
G
D
A
C
H
F
B
L
K
J
E
I
Path 1 = A-D-F-H-J-K-L =1+2+2+1+1+1+1= 9
Path 2 = A-C-F-H-J-K-L =1+2+2+1+1+1+1 = 10
Path 3 = A-D-F-G =1+2+2+3 = 8
Path 4 = A-D-F-I-J-K-L = 1+2+2+1+1+1+1= 9
Path 5 = B-C-F-H-K-L =1+2+2+1+1+1= 8
Path 6 = B-E-F-G =1+2+2+3 =8
Path 7 = B-E-F-I-J-K-L =1+2+2+1+1+1+1 = 9
Critical Path = 10 weeks
Annexure I – Questionnaire for the employees of Brax finishing Plant
- The questioner will be given to the employees in Sinhala /Tamil languages according to their preference
- The details collected in this survey will only be used for the purpose of the survey and the secrecy of the information you provide is guaranteed.
- Please put “ X” in the appropriate box
- Gender
| Male | Female |
- How long have you been working at Brax Finishing Plant
| Less than a month | 1 – 6 Months | 6 months – 1 year | More than a year |
- What time is your shift starting
| 8.30 a.m | 8.30 p.m |
How many days were you absent last month
| 0 days | 1-3 days | 3-5 days | 5-10 days | More than 10 days |
- Do you have previous experience working in a similar plant
| Yes | No |
- Does your work involve handling machinery
| Yes | No |
- Did you have the knowledge to handle such machinery before starting work at this organization?
| Yes | No |
- How did you learn to handle the machinery?
| I was given training | A colleague taught me | Learnt by myself while using the machine |
- Are you satisfied with your salary?
| Yes | No |
- Are you happy with your shift time?
| Yes | No |
- Are you satisfied with the sanitary facilities provided in the factory?
| Yes | No |
- Are you content with the working environment?
| Yes | No |
If not give the biggest issue for you in the working environment ……………………………………………………………………………………………………..
- Are you planning to stay with the company for the next three years?
| Yes | No |
Thank You!
Annexure II – Gantt chart
| Weeks Activities | September | October | November | December | ||||||||||||
| 1 | 2 | 3 | 4 | 1 | 2 | 3 | 4 | 1 | 2 | 3 | 4 | 1 | 2 | 3 | 4 | |
| Identify a business problem to be analyzed | ||||||||||||||||
| Discussions and Finalizing the issue | ||||||||||||||||
| Data Collection and Analyzing | ||||||||||||||||
| Developing, Presenting and discussion on Background Investigation Report | ||||||||||||||||
| Conducting and Developing the pilot survey report and presentation | ||||||||||||||||
| Developing the final report and presentation | ||||||||||||||||
Annexure III – Critical Path Analysis
Data Collection and Analyzing
t= 5
Developing the final report and presentation
t= 3
Conducting and Developing the pilot survey report and presentation
t= 5
Discussions and Finalizing the issue
t = 1
Identify a business problem to be analyzed
t =1
Start
t =0
Developing, Presenting and discussion on Background Investigation Report
t= 2
- All times are in weeks
Alternative paths
A = 1++1=5+2+5+3 = 17
B = 1+1+5+5+3 = 15
Critical Path = 17 weeks
Float = 17-15 = 2 weeks
References
- Read the full definition (2016) in Available at: http://www.businessdictionary.com/definition/primary-data.html (Accessed: 19 October 2016).
- Investopedia.com (2003) ‘Correlation coefficient’, in Available at: http://www.investopedia.com/terms/c/correlationcoefficient.asp (Accessed: 19 October 2016).
- http://www.pmexamsmartnotes.com/how-to-calculate-critical-path-float-and-early-and-late-starts-and-finishes/2/ (Accessed: 19 October 2016).

2 comments